


CRUDE OIL & GOLD TALKING POINTS:
- Crude oil prices pop on reports Saudi Arabia to slash output next month
- Gold prices mark time near recent highs after a week of explosive gains
- US-China trade war likely to remain the driving catalyst for commodities
Crude oil prices launched a spirited recovery Friday, marking the largest daily rise in a month. The news-wires attributed the move to reports suggesting Saudi Arabia will respond to recent weakness by limiting exports to below 7 million barrels per day in September.
Meanwhile, gold prices edged lower as markets digested substantive progress in the opposite direction for most of the preceding week. The metal did not stray far from familiar territory however, retracing some of the prior 24 hours of trend development but seemingly nothing more.
CRUDE OIL, GOLD PRICES LOOK TO US-CHINA TRADE WAR FOR DIRECTION
From here, a quiet start on the weekly economic data docket seems likely to leave broader sentiment trends in the driver’s seat for now. Clear-cut direction here is tricky to pin down as conflicting cues emerge from different parts of the global financial markets.
Bellwether S&P 500 futures are pointing cautiously higher, implying a slight risk-on tilt. Treasury bond futures and Japanese Yen are trading higher however, speaking to demand for haven and otherwise anti-risk assets that argues for a defensive tone.
News-flow shaping bets on the next round of the US-China trade war – a defining catalyst for last week’s price action – may be decisive again. While nothing is formally scheduled for release, soundbites from Washington or Beijing have scope to drive volatility.
With palpable escalation evident, the likelihood of some sort of near-term détente seems to be withering by the day. That makes a risk-off scenario appear to be the path of least resistance. That bodes ill for cycle-sensitive crude oil but might continue to buoy gold as bond yields track lower.
Get our free guide to help build confidence in your gold and crude oil trading strategy !
GOLD TECHNICAL ANALYSIS
Gold prices are marking time below resistance marked by the 61.8% Fibonacci expansion at 1513.94. Breaking higher from here initially targets the 76.4% level at 1540.70. Alternatively, a reversal back below the 50% Fib at 1492.31 sets the stage to retest the 38.2% expansion at 1470.68.
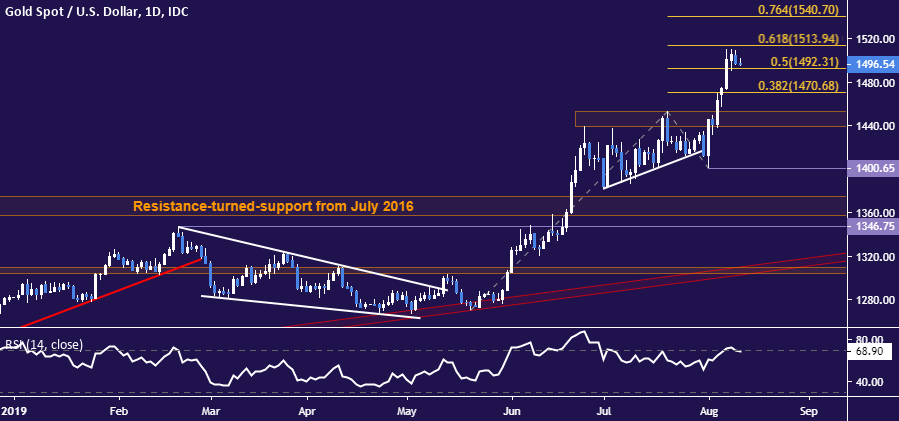
Gold price chart created using TradingView
CRUDE OIL TECHNICAL ANALYSIS
Crude oil prices rose to retest support-turned-resistance in the 54.72-56.09 area. A daily close above it opens the door for a test of a falling trend line capping gains since late May, now at 58.92. Support is in the 49.41-50.60 zone, with turn back below that setting the stage to challenge the 49.41-50.60 area.
.
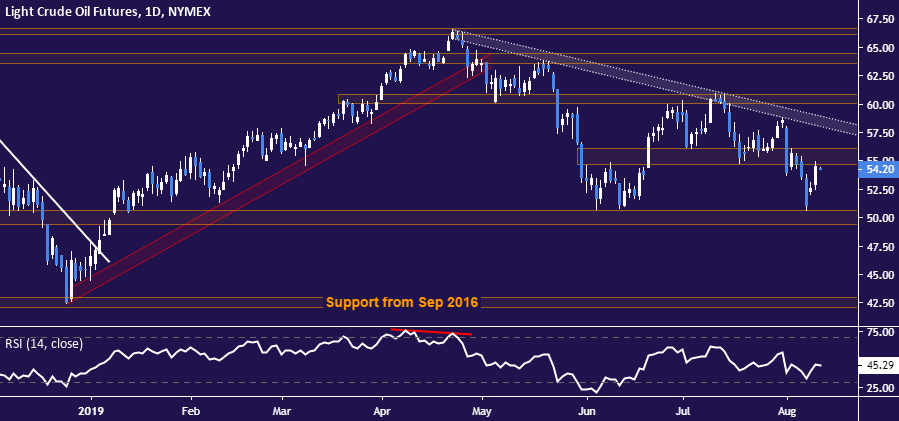
Crude oil price chart created using TradingView
COMMODITY TRADING RESOURCES
- See our guide to learn about the long-term forces driving crude oil prices
- Having trouble with your strategy? Here’s the #1 mistake that traders make
- Join a free webinar and have your commodity market questions answered
--- Written by Ilya Spivak, Currency Strategist for DailyFX.com
To contact Ilya, use the comments section below or @IlyaSpivak on Twitter


