CRUDE OIL & GOLD TALKING POINTS:
- Crude oil prices edge up as risk appetite firms in Wall St. trade
- Eurozone PMI, EIA inventories data may offer divergence cues
- Gold prices vulnerable as US Dollar attracts liquidity demand
Crude oil prices rose with stocks in risk-on Wall Street trade. Markets cheered after the US Congress reached a debt ceiling deal with the White House, reducing uncertainty and unlocking some capacity for fiscal policy support. Meanwhile, hopes for easing US-China trade war tensions emerged as a meeting between President Trump and key tech executives hinted that lowering sales restrictions on Huawei may be on the table.
The chipper move translated into higher bond yields. The US Dollar had been trending higher since the prior day, and an upshift in rates-based support certainly didn’t hurt. Taken together, that understandably eroded support for non-interest-bearing and anti-fiat assets to the detriment of gold prices.
Crude Oil Prices May See Clashing Cues in Eurozone PMI, EIA Data
Looking ahead, a downbeat set of Eurozone PMI figures might pull the spotlight back to the broader slowdown in global growth, souring sentiment and nudging oil back downward. Losses might be capped if EIA inventory data – where a 4.4-million-barrel drawdown is expected – registers closer to yesterday’s API projection calling for a mammoth 10.96-million-barrel drop.
As for gold, a risk-off shift in the markets’ mood might see lower bond yields competing for influence with a US Dollar buoyed by liquidity demand. If scope for pricing in further Fed easing is as exhausted as it seems, the Greenback might prevail and pressure the yellow metal downward.
Get the latest crude oil and gold forecasts to see what will drive prices in the third quarter!
GOLD TECHNICAL ANALYSIS
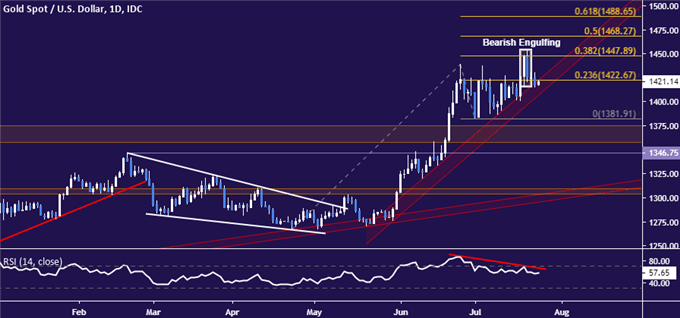
Gold prices are probing lower after putting in a Bearish Engulfing candlestick pattern. Negative RSI divergence bolsters the case for a downside scenario. A daily close below trend line support at 1406.62 exposes the July 1 low at 1381.91. Alternatively, an upturn through resistance marked by the 38.2% Fibonacci expansion at 1447.89 targets the 50% level at 1468.27.

CRUDE OIL TECHNICAL ANALYSIS
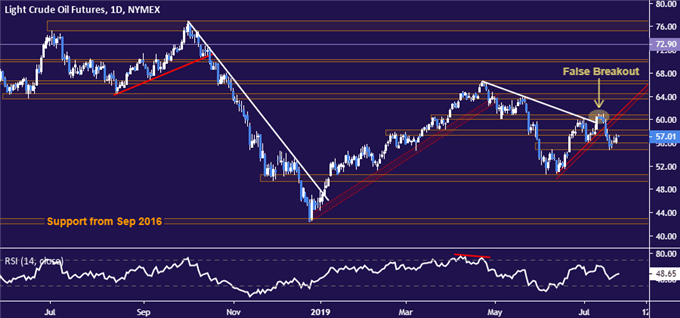
Crude oil prices are digesting losses above support at 54.84, with a modest bounce retracing a bit of recently lost ground. Immediate resistance is capped at 58.19, with a break above that opening the door to retest the 60.04-84 area. Renewed selling pressure that pierces support probably targets the 49.41-50.60 zone next.

COMMODITY TRADING RESOURCES
- See our guide to learn about the long-term forces driving crude oil prices
- Having trouble with your strategy? Here’s the #1 mistake that traders make
- Join a free webinar and have your commodity market questions answered
--- Written by Ilya Spivak, Currency Strategist for DailyFX.com
To contact Ilya, use the comments section below or @IlyaSpivak on Twitter


