


GOLD & CRUDE OIL TALKING POINTS:
- Gold prices stalled at chart support after hitting two-week low
- Crude oil prices unable to make hay of US-Iran spat, for now
- OECD outlook update may stoke risk aversion, API data due
Gold prices paused to digest after five days of consecutive losses brought them to a two-week low. An updated OECD Economic Outlook seems likely to bring downgrades of growth and inflation bets, establishing a risk-off mood. That may boost haven demand for the US Dollar, weighing on the anti-fiat yellow metal. Traders may withhold conviction ahead of Wednesday’s FOMC minutes release however, limiting follow-through.
Meanwhile, crude oil prices found a bit of a lift as US President Donald Trump threatened Iran but the move higher struggled for follow-through, with the WTI ultimately unable to make headway beyond its near-term trading range. If sentiment unravels, weakness alongside stocks seems likely. API inventory flow data is also due. It will be sized up relative to bets on a 1.7-million-barrel drawdown.
Did we get it right with our crude oil and gold forecasts? Get them here to find out!
GOLD TECHNICAL ANALYSIS
Gold prices continue to hover at support marked by a rising trend line set from mid-August 2018. This is reinforced by the 1260.80-63.76 inflection zone, with a daily close below the latter barrier exposing the 1235.11-38.00 region next. Alternatively, a breach of resistance in the 1303.70-09.12 area eyes a minor hurdle in the 1323.40-26.30 price band, followed by February’s high at 1346.75.

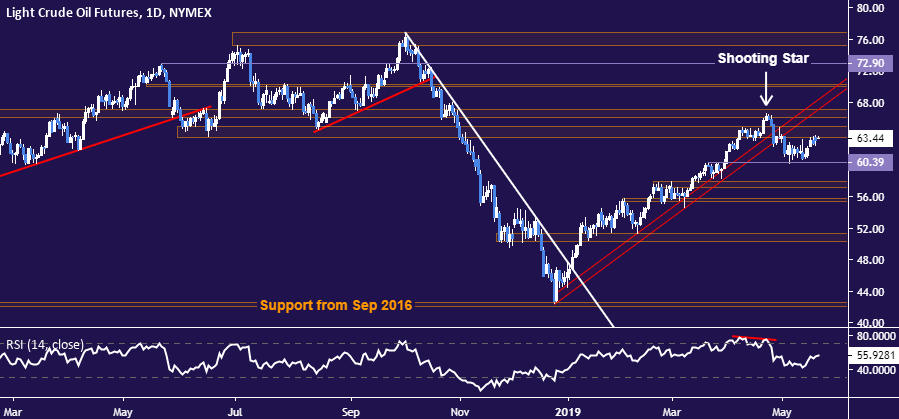
CRUDE OIL TECHNICAL ANALYSIS
Crude oil prices remain capped below a dense bloc of overlapping resistance levels in the 63.59-67.03 area. Near-term support is at 60.39, with a daily close below that exposing the 57.24-88 area. Alternatively, a push all the way through resistance targets the $70/bbl figure thereafter.
COMMODITY TRADING RESOURCES
- See our guide to learn about the long-term forces driving crude oil prices
- Having trouble with your strategy? Here’s the #1 mistake that traders make
- Join a Trading Q&A webinar to answer your commodity market questions
--- Written by Ilya Spivak, Currency Strategist for DailyFX.com
To contact Ilya, use the comments section below or @IlyaSpivak on Twitter


