


CRUDE OIL & GOLD TALKING POINTS:
- Crude oil prices rise amid a flurry of supportive headlines
- Gold prices decline on status-quo FOMC meeting minutes
- US-China trade talks may overshadow incoming data flow
Crude oil prices found a menu of reasons to accelerate higher yesterday. A Pemex pipeline in Huauchinango, Mexico exploded, stoking supply fears. Saudi Energy Minister Khalid Al-Falih said the market will reach balance by April. OPEC+ compliance with coordinated output cuts reportedly registered at a solid 83 percent in January. API said US stockpiles added a relatively modest 1.26 million barrels last week.
Meanwhile, gold prices fell after touching a fresh 10-mont high intraday as minutes from January’s FOMC meeting crossed the wires. While the document was predictably defensive, it offered nothing particularly ground-breaking that might’ve inspired a further dovish shift in policy bets (as expected). The US Dollar retraced some anticipatory losses as a result, undercutting the appeal of anti-fiat alternatives.
US-CHINA TRADE TALKS MAY OVERSHADOW EIA, PMI, DURABLES DATA
Official EIA inventory flow data is now in the spotlight for oil. Forecasts point to a rise of 2.63 million barrels. A smaller gain echoing the API projection might offer the prices a further lift. Meanwhile, gold will focus on a raft of US economic activity proxies, with December’s durable goods orders and February’s Markit PMI data taking top billing. Upbeat results may buoy yields and hurt the yellow metal.
All this might be overshadowed by US-China trade negotiations however. The two nations are reportedly working on six memorandums of understanding (MOUs) addressing key points of bilateral friction including agriculture, intellectual property and trade in services. Further signs of progress may boost risk appetite, sending oil higher alongside stocks. Gold may be pressured in this scenario.
See our guide to learn about the long-term forces driving crude oil prices !
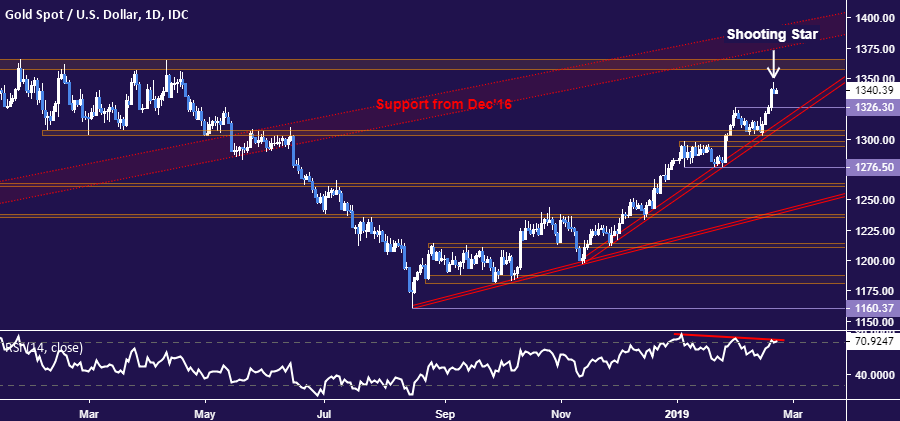
GOLD TECHNICAL ANALYSIS
Gold prices put in a Shooting Star candlestick following yesterday’s dramatic surge, hinting at indecision that might precede a pullback. Negative RSI divergence bolsters the case for a downturn. A drop back below the January 31 highat 1326.30 exposes rising trend line support at 1308.80. Critical resistance remains in the 1357.50-66.06 area.
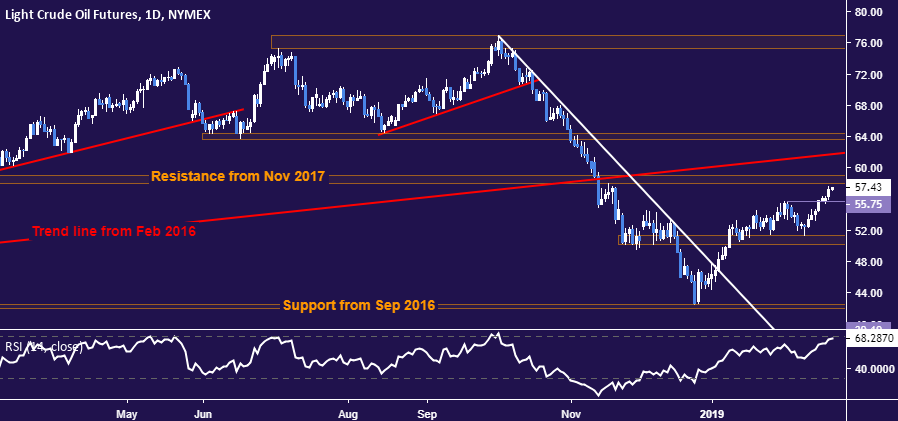
CRUDE OIL TECHNICAL ANALYSIS
Crude oil prices are within a hair of resistance in the 57.96-59.05 area. A break above it confirmed on a daily closing basis targets trend line support-turned-resistance set from February 2016, now at 61.75. Alternatively, a reversal back below the February 4 high at 55.75 – now recast as support – sets the stage for a retest of the 50.15-51.33 zone.
COMMODITY TRADING RESOURCES
- Learn what other traders’ gold buy/sell decisions say about the price trend
- Having trouble with your strategy? Here’s the #1 mistake that traders make
- Join a Trading Q&A webinar to answer your commodity market questions
--- Written by Ilya Spivak, Currency Strategist for DailyFX.com
To contact Ilya, use the comments section below or @IlyaSpivak on Twitter


