


CRUDE OIL & GOLD TALKING POINTS:
- Crude oil prices rise with stocks on US-China trade war deal hopes
- Gold prices fall as yields rise in risk-on trade, tarnishing its appeal
- December FOMC meeting minutes, EIA inventory data next on tap
Firming risk appetite buoyed cycle-sensitive crude oil prices yesterday, with the benchmark WTI contract tracking stocks upward. Gold prices fell as the risk-on mood translated into higher bond yields, sapping the appeal of non-interest-bearing assets (as expected). Hopes for a breakthrough in US-China trade talks seemed to be at work after negotiators from Washington DC extended their stay in Beijing by a day.
CRUDE OIL, GOLD PRICES FOCUSED ON FOMC MEETING MINUTES
The spotlight now turns to the release of minutes from December’s FOMC meeting. Official forecasts released after that sit-down envisioned two interest rate hikes in 2019. For their part, financial markets are pricing in standstill. Speculation about the likely path toward reconciling this disparity is likely to shape price action in the commodity markets.
If the Minutes document presents a relatively upbeat Fed that makes the case for continued tightening, a rise in Treasury yields and the US Dollar is likely to weigh on gold. The implications for crude oil are somewhat clouded in this scenario: a sanguine stance may be supportive for growth and demand bets, but the likely stronger Greenback that follows therefrom may bode ill for USD-denominated assets.
On the other hand, a cautious tone might be interpreted as ratifying the markets’ dovish disposition. That will probably help gold as the Dollar and bond yields decline. Hopes for a diminishing monetary policy headwind may buoy risk appetite too, boosting crude oil alongside stocks. A further lift may come from EIA inventory flow data if it echoes impressively supportive API statistics published yesterday.
See our guide to learn about the long-term forces driving crude oil prices !
GOLD TECHNICAL ANALYSIS
Gold prices produced a bearish Dark Cloud Cover candlestick pattern, hinting a top may be taking shape. From here, a daily close below support at 1282.27 exposes the 1257.60-66.44 area (former resistance, rising trend line). Alternatively, a rebound above the 1302.97-07.32 zone initially targets a minor barrier at 1323.60, followed by a trend-defining ceiling in the 1357.50-66.06 region.

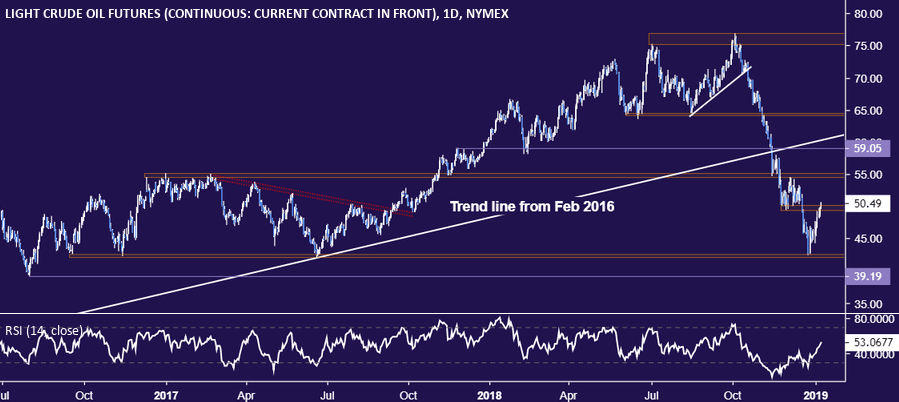
CRUDE OIL TECHNICAL ANALYSIS
Crude oil prices are testing support-turned-resistance in the 49.41-50.15 area. A break above that confirmed on a daily closing basis sees the next upside hurdle in the 54.51-55.24 area. Immediate support is in the 42.05-55 zone. A turn lower that takes prices below this barrier opens the door for a challenge of the August 2016 bottom at 39.19.
COMMODITY TRADING RESOURCES
- Learn what other traders’ gold buy/sell decisions say about the price trend
- Having trouble with your strategy? Here’s the #1 mistake that traders make
- Join a Trading Q&A webinar to answer your commodity market questions
--- Written by Ilya Spivak, Currency Strategist for DailyFX.com
To contact Ilya, use the comments section below or @IlyaSpivak on Twitter


