


GOLD & CRUDE OIL TALKING POINTS:
- Gold price chart reveals bearish cues before November US jobs report
- Outcome in line with forecasts may boost Fed rate hike bets, US Dollar
- Crude oil prices at risk as OPEC+ output cut accord fails to impress
Gold prices ventured higher amid risk aversion yesterday as expected, with a drop in bond yields boosting the relative appeal of non-interest-bearing alternatives. A late-day recovery on Wall Street put this dynamic in reverse however, with rates rising alongside share prices as the yellow metal retreated to finish the session little-changed.
Crude oil prices were already pressured by the early risk-off push when it because apparent that OPEC and its allies would not reach a deal on a new round of coordinated output cuts at a meeting in Vienna. That understandably amplified the move lower. The last-minute improvement in risk appetite made itself felt here as well however, with the WTI contract trimming the day’s losses as US stocks seesawed upward.
COMMODITIES MAY FALL AS US JOBS DATA BOOSTS DOLLAR
November’s US jobs report headlines the economic data docket from here. An on-trend rise of 198k in nonfarm payrolls is expected while the unemployment rate holds at a five-decade low of 3.7 percent and wage growth matches the nine-year high of 3.1 percent set in the prior month. Leading PMI survey data echoes such forecasts, pointing to significant labor price pressure despite relatively steady economic activity.
Outcomes broadly in line with these projections may serve to drive home the point that the Fed’s recent pivot toward a more data-dependent posture need not imply a dovish swing in policy. That stands to boost recently soggy interest rate hike bets, sending the US Dollar and punishing anti-fiat alternatives epitomized by gold. Crude oil may also suffer alongside the spectrum of USD-denominated assets.
OPEC+ OUTPUT CUT DEAL UNLIKELY TO IMPRESS MARKETS
A follow-up meeting of the so-called OPEC+ collective – a group comprising officials from the cartel and like-minded oil producers such as Russia – is also noteworthy. They will try to mend yesterday’s disappointing outing with a deal to reduce collective output in 2019. Anything short of an implausibly large drawdown may fail to impress however as US exports surge. Indeed, they hit a record high last week.
Learn what other traders’ gold buy/sell decisions say about the price trend!
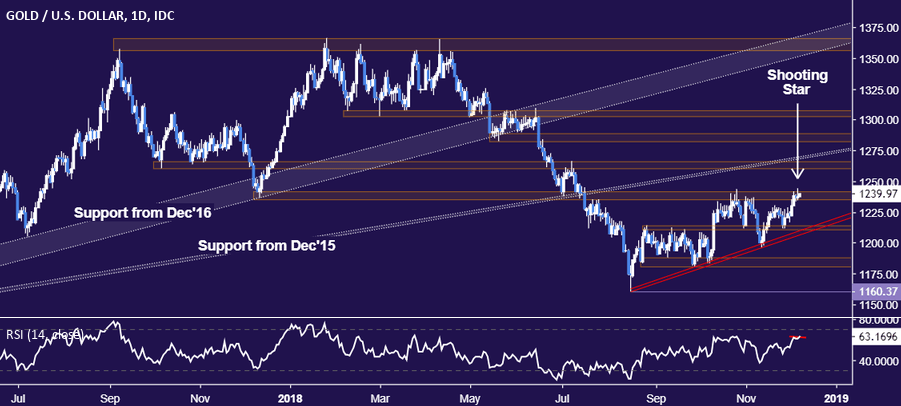
GOLD TECHNICAL ANALYSIS
The appearance of a Shooting Star candlestick coupled with negative RSI divergence on a test of resistance in the 1235.24-41.64 area hints gold prices may turn lower. A break below rising trend line support at exposes the 1180.86-87.83 zone next. Alternatively, a daily close above 1241.64 opens the door for a test of the 1260.80-66.44 region.
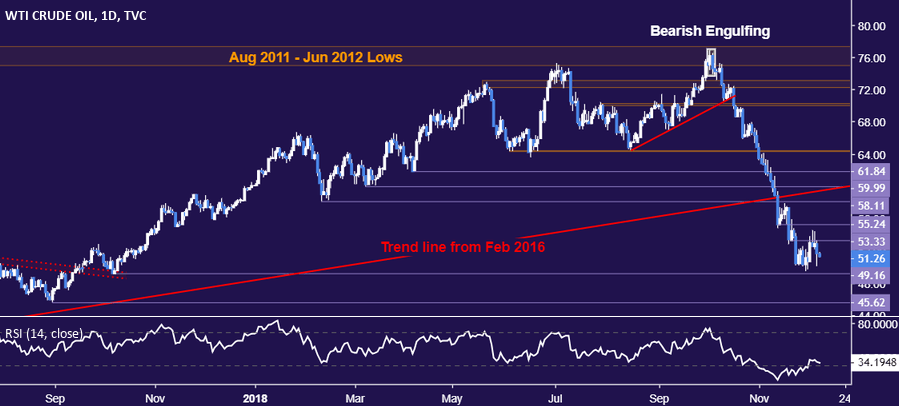
CRUDE OIL TECHNICAL ANALYSIS
Crude oil prices recoiled from resistance at 53.33 (former support, falling trend line), as expected. From here, a daily close below the October 9, 2017 bottom at 49.16 targets the August 31, 2017 low at 45.62. Alternatively, a rebound through 53.33 aims for support-turned-resistance at 55.24.
COMMODITY TRADING RESOURCES
- See our guide to learn about the long-term forces driving crude oil prices
- Having trouble with your strategy? Here’s the #1 mistake that traders make
- Join a Trading Q&A webinar to answer your commodity market questions
--- Written by Ilya Spivak, Currency Strategist for DailyFX.com
To contact Ilya, use the comments section below or @IlyaSpivak on Twitter


