


GOLD & CRUDE OIL TALKING POINTS:
- Gold price bounce fizzles as the US Dollar reclaims yield appeal
- Crude oil prices correct higher but near-term chart resistance holds
- Hawkish Fed-speak may hurt commodities, API inventory data due
Gold prices seesawed, with early gains on the back of a weaker US Dollar erased by day’s end Monday. The reversal mirrored the Greenback’s intraday recovery, with initial pressure evaporating as yields rose and the priced-in 2019 Fed rate hike outlook steepened in risk-on trade (as expected).
The markets’ brighter disposition – which seems to reflect hopes for de-escalation in the US vs. China trade war after this week’s G20 summit – helped crude oil prices manage a corrective upswing. The move conspicuously failed to retake support broken amid last week’s selloff however (see chart below).
COMMODITIES MAY FALL AS FED-SPEAK BOOSTS US DOLLAR
Looking ahead, a busy Fed-speak calendar takes top billing. Comments from Vice Chair Richard Clarida as well as regional branch presidents Esther George (Kansas City), Charles Evans (Chicago) and Raphael Bostic (Atlanta) are all due to cross the wires.
Above all, this marks an opportunity for Mr Clarida to clarify his recent remarks citing external economic headwinds. Markets seemed to interpret this as a signal that the Fed may dial back the pace of tightening as a response to adverse developments abroad.
Were that what was intended, it would be a stark departure from the position set by Chair Powell throughout the year. It holds that the Fed sets rates to meet its mandated employment and inflation objectives, with outside influences considered only to the extent that they demonstrably impact conditions domestically.
As it stands, US economic data flow has broadly improved relative to baseline forecasts in the past three months. With that in mind, the Fed’s commitment to vigilance probably should not be confused with a dovish turn in the baseline policy trajectory.
If Mr Clarida makes clear as much, the US Dollar will probably gain ground. That bodes ill for perennially anti-fiat gold prices. It might weigh on oil as well by way of applying de-facto downside pressure on the spectrum of assets denominated in USD terms on global markets.
US crude inventory flow figures from API are in focus on the data front. They will be judged against forecasts calling for slight 87k barrel drawdown to be reported in official EIA statistics due Wednesday. A larger outflow might boost prices, while a smaller one – or an unexpected increase – may send them lower.
Learn what other traders’ gold buy/sell decisions say about the price trend!
GOLD TECHNICAL ANALYSIS
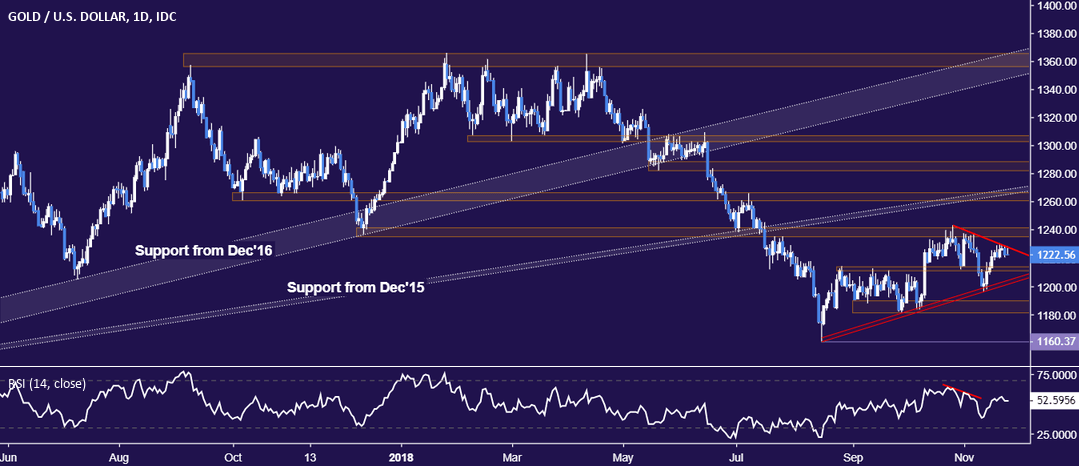
Gold prices remain anchored to falling trend line resistance set from late October, now at 1227.28. Breaking above it on a daily closing basis paves the way for a test of support-turned-resistance in the 1235.24-41.64 area. Alternatively, a turn back below the 1211.05-14.30 chart inflection region targets upward-slowing support at 1202.20.
CRUDE OIL TECHNICAL ANALYSIS
Crude oil prices bounced to re-test support-turned-resistance in the 52.10-83 area. A daily close back above this threshold opens the door for another challenge of another former support in the 54.48-55.21 zone. Alternatively, renewed downside momentum that brings prices through the October 2017 low at 49.16 exposes the August 31 2017 bottom at 45.62.

COMMODITY TRADING RESOURCES
- See our guide to learn about the long-term forces driving crude oil prices
- Having trouble with your strategy? Here’s the #1 mistake that traders make
- Join a Trading Q&A webinar to answer your commodity market questions
--- Written by Ilya Spivak, Currency Strategist for DailyFX.com
To contact Ilya, use the comments section below or @IlyaSpivak on Twitter


