


CRUDE OIL & GOLD TALKING POINTS:
- Crude oil prices hit 13-month low, breach critical chart support
- Gold prices down as EUR/USD fall broadly boosts the US Dollar
- S&P 500 futures hint at risk-on mood, G20 summit now in focus
Crude oil prices plunged Friday, with the WTI benchmark sinking to the lowest in 13 months. Oversupply fears appear to remain the source of selling pressure. The latest drop seems to have been triggered by comments from Saudi oil minister Khalid Al-Falih, who said output increased again this month.
Looking ahead, all eyes are on the G20 summit in Argentina. Central bank heads and finance ministers will begin to gather Monday. Reports cited by Bloomberg suggest oil ministers from Saudi Arabia and Russia are due to appear as well. Leaders of the participating nations will join in Friday and meet over the weekend.
Thus far, Russia has been reluctant to join calls for another coordinated supply reduction. If incoming commentary suggests officials from Moscow and Riyadh are finding common ground on the matter, oil may recover. However, rhetoric hinting at divergence may compound selling pressure.
GOLD MAY FALL AS YIELDS RISE IN RISK-ON TRADE
Gold prices also turned lower Friday as the US Dollar rose, sapping the appeal of anti-fiat alternatives. The Greenback rose as a drop in the bellwether EUR/USD exchange rate following disappointing Eurozone PMI data reverberated as broader-based support.
Sentiment trends may prove decisive in the day ahead. S&P 500 futures are pointing convincingly higher following a broadly upbeat start to the weekly on Asia Pacific bourses, arguing for a risk-on bias. That may bode ill for non-interest-bearing assets including the yellow metal.
See our guide to learn about the long-term forces driving crude oil prices !
GOLD TECHNICAL ANALYSIS
Gold prices continue to test falling trend line resistance set from late October, now at 1227.64. A daily close above that exposes the 1235.24-41.64 area. Alternatively, a move back below the 1211.05-14.30 chart inflection region exposes upward-slowing support at 1201.82.

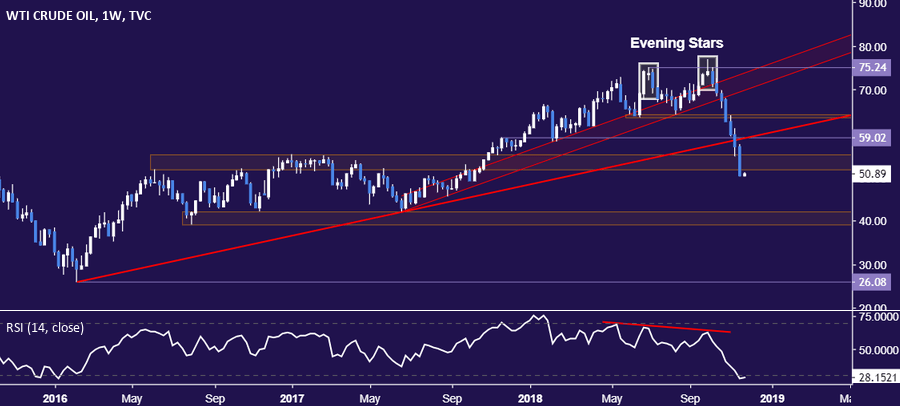
CRUDE OIL TECHNICAL ANALYSIS
Crude oil prices accelerated downward, crashing through support in the 52.34-83 area to expose the October 2017 low at 49.16. A further push below that aims for the August 31 2017 bottom at 45.62. Former support barriers in the 52.10-83 and 54.48-55.21 zones have been recast as near-term resistance.

Longer-term positioning looks more ominous still. The bearish reversal emanating from the top identified near the $75 figure has now breached major resistance-turned support in the 51.64-55.21 region on a weekly closing basis. A similarly significant downside hurdle doesn’t seem to appear until the 39.23-42.23 area.
COMMODITY TRADING RESOURCES
- Learn what other traders’ gold buy/sell decisions say about the price trend
- Having trouble with your strategy? Here’s the #1 mistake that traders make
- Join a Trading Q&A webinar to answer your commodity market questions
--- Written by Ilya Spivak, Currency Strategist for DailyFX.com
To contact Ilya, use the comments section below or @IlyaSpivak on Twitter


