


CRUDE OIL & GOLD TALKING POINTS:
- Crude oil prices drop to a 13-month low as oversupply fears reemerge
- Gold prices fall as firming Fed view boosts yields despite risk aversion
- EIA inventory data echoing API forecast might offer crude oil a lifeline
Crude oil prices swooned as global oversupply fears returned. The drop followed a report from S&P Global Platts saying China’s crude inventories quadrupled in October. It added that a further build is likely in November as demand wanes. Doubts about the potency of further OPEC supply cuts were already swirling, with the large restocking by the world’s second-largest oil consumer seemingly pushing prices over the edge.
The plunge spilled over into broader risk aversion, with energy-linked names leading Wall Street to its largest one-day drop in a month. Rebuilding Fed rate hike expectations seemed to compound the selloff. In fact, Treasury bond yields and the US Dollar rose despite the risk-off mood as the 2019 tightening path implied in Fed Funds futures steepened. Not surprisingly, anti-fiat gold prices fell against this backdrop.
CRUDE OIL PRICES MAY BOUNCE ON EIA INVENTORY DATA
Looking ahead, crude oil prices may find some room to recover if EIA inventory flow statistics echo a forecast from API projecting a narrow 1.55 million barrel outflow. A similar outcome in official figures would contrast sharply with forecasts calling for a 2.87 million barrel build. As for gold prices, the near-term outlook is somewhat clouded.
S&P 500 futures are pointing higher, hinting at a risk-on mood that might be expected to buoy yields and weigh on the yellow metal. Yesterday’s performance warns against assuming such things however. If worries about an aggressive Fed were at least partly responsible for that selloff, a pre-holiday correction may bring the reverse – an uptick alongside share prices. In any case, substantive trend development seems unlikely.
See our guide to learn about the long-term forces driving crude oil prices !
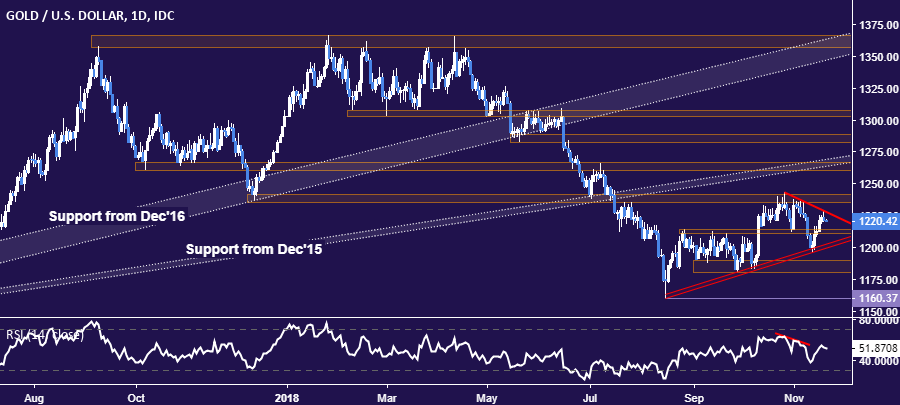
GOLD TECHNICAL ANALYSIS
Gold prices snapped a five-day winning streak, recoiling form a test of trend line resistance set from late October. A reversal below support in the 1211.05-14.30 area exposes rising trend support, now right at the $1200/oz figure. Alternatively, a push above resistance – now at 1228.11 – opens the door for a challenge of the 1260.80-66.44 zone.
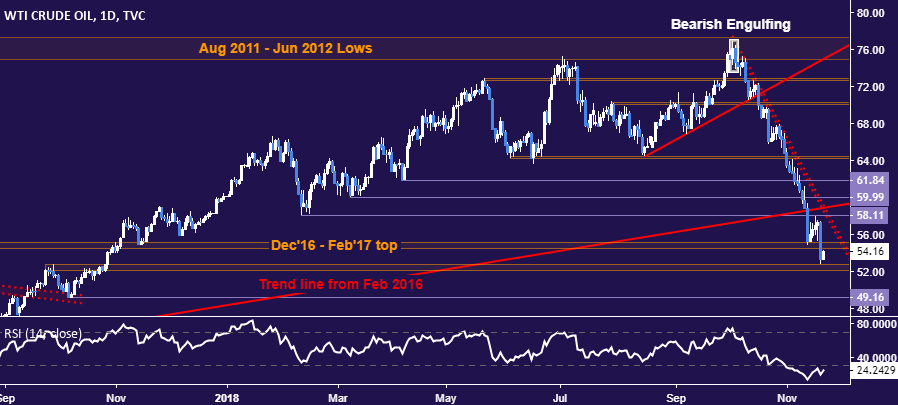
CRUDE OIL TECHNICAL ANALYSIS
Crude oil prices crashed through support in the 54.48-55.21 area to challenge the next downside barrier in the 52.34-83 zone next. A daily close below that exposes the October 2017 low at 49.16. Alternatively, a move back above 55.21 paves the way for a retest of 58.11, the February 9 low.
COMMODITY TRADING RESOURCES
- Learn what other traders’ gold buy/sell decisions say about the price trend
- Having trouble with your strategy? Here’s the #1 mistake that traders make
- Join a Trading Q&A webinar to answer your commodity market questions
--- Written by Ilya Spivak, Currency Strategist for DailyFX.com
To contact Ilya, use the comments section below or @IlyaSpivak on Twitter


