


GOLD & CRUDE OIL TALKING POINTS:
- Gold and crude oil prices seesaw, echoing US Dollar after midterm election
- Intraday gains evaporated as markets risk appetite, Fed rate hike bets firmed
- Upbeat FOMC policy announcement may punish commodity prices further
Commodity prices seesawed in the aftermath of US midterm elections yesterday. Initial US Dollar weakness offered a lift as markets worried about fiscal policy deadlock after the Democrats secured a hold on the House of Representatives while Republicans successfully defended (and expanded) their majority in the Senate. The move came undone over the course of the day however, as expected.
Perhaps most tellingly, the Greenback recovered alongside rising stock prices while the priced-in 2019 interest rate hike outlook implied in Fed Funds futures steepened to its most hawkish setting in a month. That seemingly ratifies last week's forecast suggesting as much would happen as markets envision a growth- and inflation-boosting bipartisan infrastructure spending effort.
GOLD, CRUDE OIL MAY FALL AS US DOLLAR GAINS ON FOMC
From here, the spotlight turns to the FOMC monetary policy announcement. A rate hike is not expected, with markets all but certain that further tightening will wait until December. The tone of the accompanying policy statement may yet be market-moving however, with an optimistic tone triggering a hawkish shift in baseline projections that sends USD higher. That bodes ill for gold and crude oil prices alike.
Evidence supporting such an outcome seems compelling. US data outcomes have improved relative to forecasts since September’s conclave, according to data form Citigroup. Meanwhile, leading PMI survey data points to a growth pickup in October after four months of moderation. Further still, wage inflation has jumped to a nine-year high.
Learn what other traders’ gold buy/sell decisions say about the price trend!
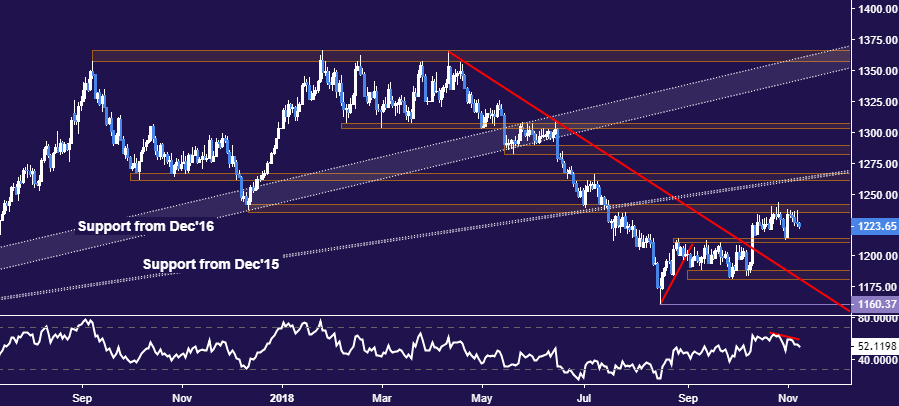
GOLD TECHNICAL ANALYSIS
Gold prices are inching lower after yet another test of resistance in the 1235.24-41.64 area. Immediate support is in the 1211.05-14.30 area, with a daily close below that paving the way for a retest of the 1180.86-87.83 zone. Alternatively, a push above 1241.64 sees the next upside barrier in the 1260.80-66.44 region.
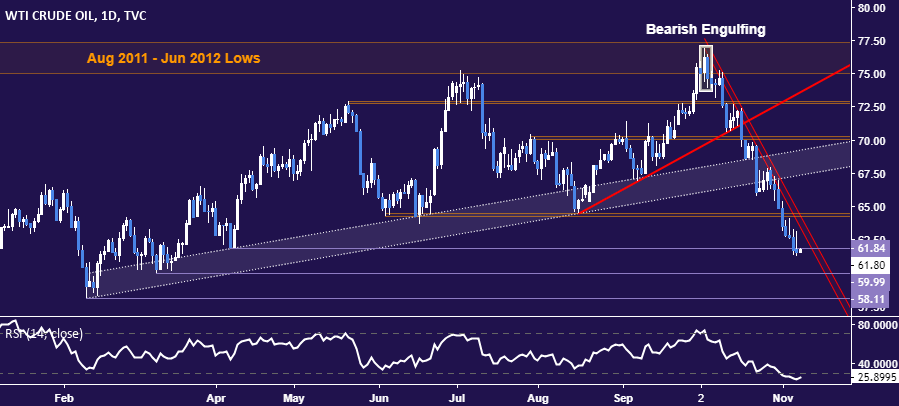
CRUDE OIL TECHNICAL ANALYSIS
Crude oil prices’ retest of support-turned-resistance at 61.84, April 6 low, ended in failure, with an intraday rally evaporating and turning into a loss by day’s end. From here, break below the $60/bbl figure exposes the February 9 bottom at 58.11. Alternatively, a daily close back above 61.84 opens the door for a retest of the 64.26-45 area. The longer-term setup on the weekly chart suggests a major top has been established.
COMMODITY TRADING RESOURCES
- See our guide to learn about the long-term forces driving crude oil prices
- Having trouble with your strategy? Here’s the #1 mistake that traders make
- Join a Trading Q&A webinar to answer your commodity market questions
--- Written by Ilya Spivak, Currency Strategist for DailyFX.com
To contact Ilya, use the comments section below or @IlyaSpivak on Twitter


