CRUDE OIL & GOLD TALKING POINTS:
- Commodity prices echo US Dollar as risk sentiment trends seesaw
- Risk-on lead from emerging markets undone by US, China trade war
- Weekly API statistics on US oil inventory flows now in the spotlight
Commodity prices initially rose as emerging market currencies traded higher at the start of the trading week, cooling investors’ worries about instability in the space and sapping the haven appeal of the US Dollar. That led the benchmark unit lower, boosting perennially anti-fiat gold and offering a de-facto lift to assets priced in USD terms on global markets, including crude oil.
The move reversed course as trade war worries re-emerged amid speculation that the US would move ahead with $200 billion in additional tariffs targeting China. Shares plunged at the opening bell on Wall Street, arresting the greenback’s decline and pushing it up off session lows. Crude oil and gold prices tellingly fell alongside the bellwether S&P 500. The move accelerated as the tariff increase was confirmed.
API INVENTORY FLOW DATA ON TAP
Looking ahead, the private-sector estimate of weekly US oil inventory flows from API is in focus. The outcome will be judged against forecasts calling for a 2.7 million barrel drawdown to be reported in official EIA statistics due Wednesday. A smaller draw may weigh on crude prices while a larger one might offer them an upside push.
See our guide to learn about the long-term forces driving crude oil prices !
GOLD TECHNICAL ANALYSIS
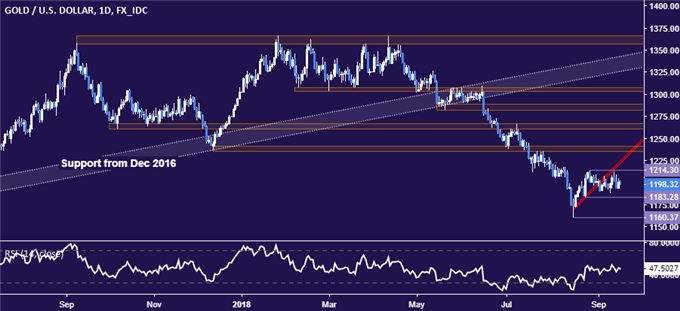
Gold prices are still trading water below the August 28 high at 1214.30. A break above that on a daily closing basis targets support-turned-resistance in the 1235.24-41.64 area. Alternatively, a push below the August 24 lowat 1183.28 paves the way for a retest of the swing bottom at 1160.37.

CRUDE OIL TECHNICAL ANALYSIS
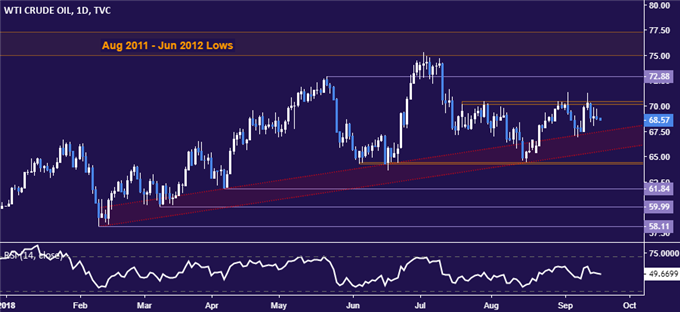
Crude oil prices continue to mark time below resistance in the 70.15-41 area. From here, a daily close below rising trend support in the 65.55-67.44 zone exposes the 64.26-45 zone. Alternatively, a break above resistance opens the door for a retest of the chart inflection point at 72.88.

COMMODITY TRADING RESOURCES
- See our guide to learn about the long-term forces driving crude oil prices
- Having trouble with your strategy? Here’s the #1 mistake that traders make
- Join a Trading Q&A webinar to answer your commodity market questions
--- Written by Ilya Spivak, Currency Strategist for DailyFX.com
To contact Ilya, use the comments section below or @IlyaSpivak on Twitter


