


GOLD & CRUDE OIL TALKING POINTS:
- Gold prices locked in place as US Dollar, Treasury yields diverge
- Crude oil prices still waiting for clarity on OPEC+ output quotas
- S&P 500 futures hint at risk-off mood before Trump/Kim meeting
Gold prices continued to mark time Friday, torn between conflicting cues from rising Treasury bond yields and a retreating US Dollar. The former undermined the appeal of non-interest-bearing assets and pressured the yellow metal lower while the latter bolstered demand for anti-fiat alternatives, offering it support.
Crude oil prices edged lower, oscillating within a range that prevailed for all of last week as traders weighed up prospects for an easing of output curbs adopted by OPEC-led producers to drain a global supply glut. Saudi Arabia and Russia appear in favor, but other top exporters – such as Iraq – stand in opposition.
RISK APPETITE SOFT BEFORE TRUMP/KIM MEETING
Looking ahead, S&P 500 futures are pointing to a somewhat risk-off tone. This might boost haven demand for the greenback and Treasury bonds alike, weighing on yields and keeping gold prices anchored. Sentiment-sensitive oil prices edge down alongside stocks but substantive follow-through seems unlikely until after the outcome of Tuesday’s meeting between US President Trump and North Korea’s Kim Jong Un.
Learn what other traders’ gold buy/sell decisions say about the price trend!
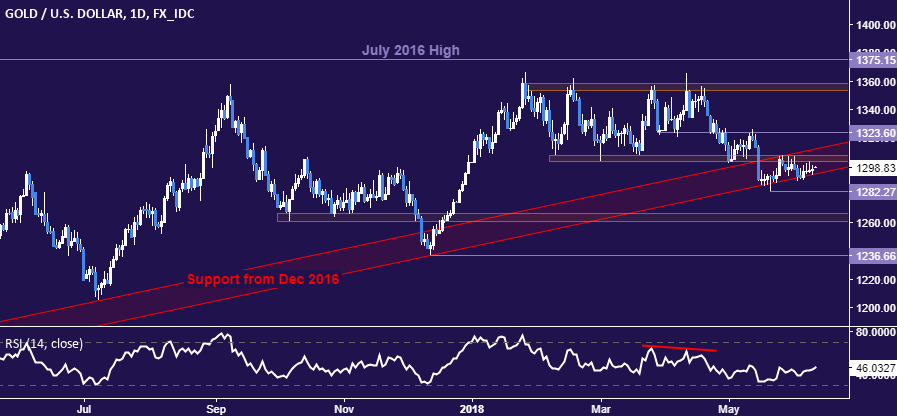
GOLD TECHNICAL ANALYSIS
Gold prices continue to drift along the lower boundary of support defining the uptrend started in December 2016, now at 1294.38. A daily close below that exposes the May 21 low at 1282.27, followed by support in the 1260.80-66.44 area. Alternatively, a move above the upper layer of trend support at 1311.75 targets the chart inflection point at 1311.34.
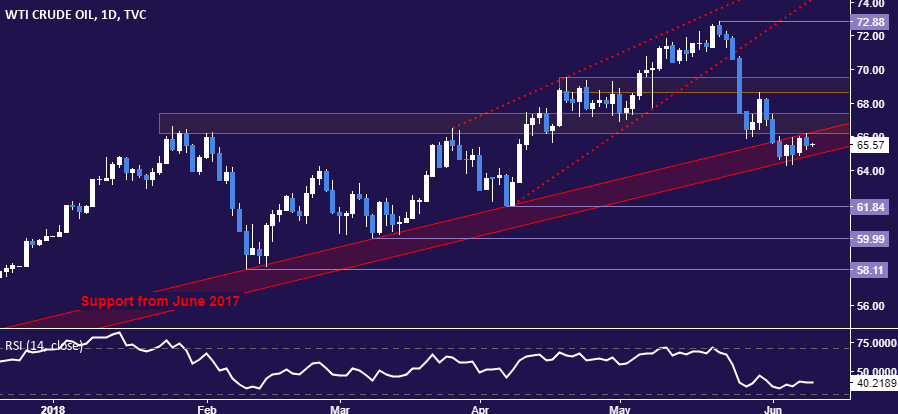
CRUDE OIL TECHNICAL ANALYSIS
Crude oil prices continue to negotiate support defining the rising trend in play since June 2017. A break of this barrier’s lower boundary, now at 64.97, initially exposes the April 6 low 61.84. Alternatively, a reversal above resistance in the 66.22-67.36 area opens the door for a challenge of the 68.64-69.53 region.
COMMODITY TRADING RESOURCES
- See our guide to learn about the long-term forces driving crude oil prices
- Having trouble with your strategy? Here’s the #1 mistake that traders make
- Join a Trading Q&A webinar to answer your commodity market questions
--- Written by Ilya Spivak, Currency Strategist for DailyFX.com
To contact Ilya, use the comments section below or @IlyaSpivak on Twitter


