Talking Points:
- Crude oil prices track stocks prices upward ahead of Powell testimony
- Gold price recovery struggles to gain steam at trend-defining support
- See our guide to learn what are the long-term forces driving crude oil
Crude oil prices continued to take their cues from a broader recovery in market sentiment, with the WTI benchmark tracking higher alongside the S&P 500 stock index. Gold prices edged up too, although a late-day recovery in the US Dollar cooled momentum for the standby alternative to paper currencies.
On balance, price action seems to have reflected pre-positioning ahead of upcoming Congressional testimony from newly-minted Fed Chairman Jerome Powell. Markets are hoping he will signal a reluctance to raise rates quickly against a backdrop of market turmoil similar to that seen in early February.
Investors’ disposition is likely to brighten further if Mr Powell seems to suggest as much, sending commodity prices higher. If some of his earlier remarks prove telling however, markets may be in for a disappointment. If he seems reluctant to take his cues from asset values, oil and gold may sink in tandem.
Find out here what retail traders’ gold buy and sell decisions hint about the price trend!
GOLD TECHNICAL ANALYSIS
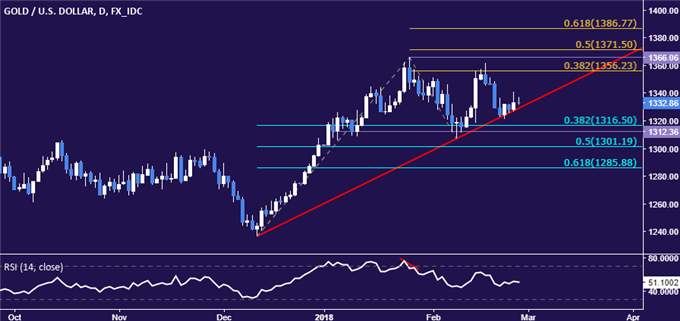
Gold prices continue to cling to rising trend line support set from mid-December, now at 1329.55. Breaking below this barrier on a daily closing basis exposes the 1312.36-16.50 area (38.2% Fib retracement, support shelf). Alternatively, push above the 38.2% Fibonacci expansionat 1356.23 targets the 1366.06-71.50 zone (January 25 high, 50% expansion).

CRUDE OIL TECHNICAL ANALYSIS
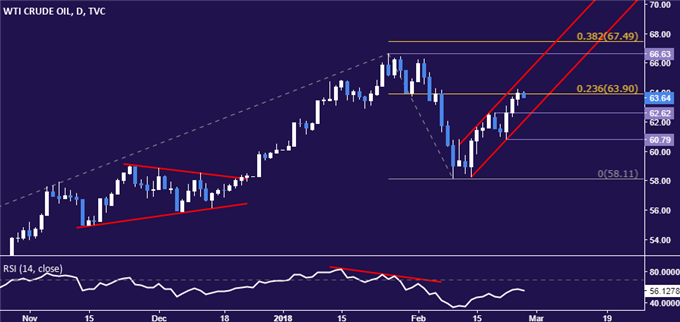
Crude oil prices narrowly breached the 23.6% Fibonacci expansion at 63.90. From here, a push above channel resistance at 65.20 targets the 66.63-67.49 area (January 25 high, 38.2% level). Alternatively, a move back below the 62.11-62 area (channel floor, February 20 high) sees the next downside barrier at 60.79, the February 22 low.

--- Written by Ilya Spivak, Currency Strategist for DailyFX.com
To contact Ilya, use the comments section below or @IlyaSpivak on Twitter
To receive Ilya's analysis directly via email, please SIGN UP HERE


