


Talking Points:
- Crude oil prices edge down as upbeat jobs data boosts the US Dollar
- Gold prices break another layer of support, vulnerable to deeper losses
- See our guide to learn what are the long-term forces driving crude oil
January’s US jobs report proved to be formative for commodities prices last week. The US Dollar soared after the upbeat results crossed the wires. That understandably sent gold prices lower as the benchmark currency’s gains undermined the appeal of alternatives to fiat. Crude oil prices likewise fell, succumbing to de-facto pressure from a stronger greenback.
Looking ahead, the service-sector ISM survey is in focus, where an improvement in the pace of activity growth is expected. If the Dollar is recoupling with Fed-driven fundamentals in earnest – the currency slid for three months straight despite a firming rate hike outlook, after all – an upbeat print ought to see it continue higher. That may well give commodity prices another downward push.
Find out here what retail traders’ gold trade decisions hint about the price trend!
GOLD TECHNICAL ANALYSIS – Gold prices continued to edge lower after last week’s bearish breakout, with sellers now seemingly pointed to challengethe 38.2% Fibonacci retracement at 1316.50. A daily close below that exposes the 50% level at 1301.19. Alternatively, a reversal back above the 23.6% Fibat 1335.44 targets the February 1 high at 1351.10.
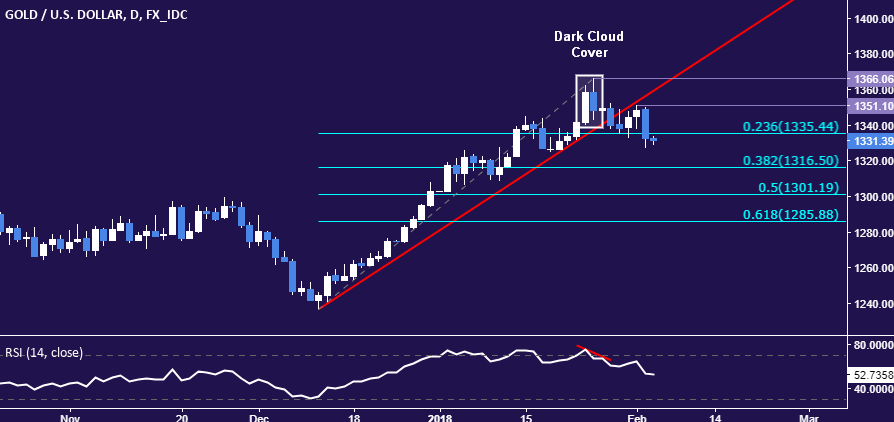
Chart created using TradingView
CRUDE OIL TECHNICAL ANALYSIS – Crude oil prices continue to mark time below the January 25 high at 66.63. A daily close above this barrier exposes the 38.2% Fibonacci expansion at 67.65. Near-term support is at 63.64, the January 31 low, with a break below that opening the door for a test of the 38.2% Fib retracement at 62.62. Negative RSI divergence hints the path of least resistance leads downward.
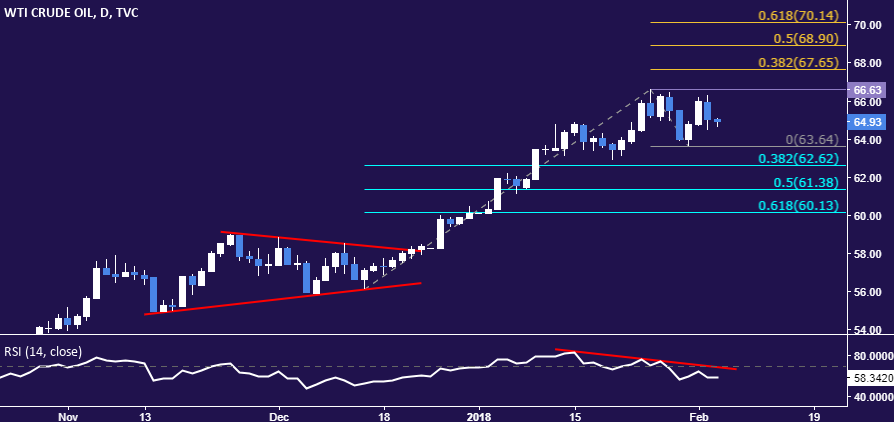
Chart created using TradingView
--- Written by Ilya Spivak, Currency Strategist for DailyFX.com
To receive Ilya's analysis directly via email, please SIGN UP HERE
Contact and follow Ilya on Twitter: @IlyaSpivak


