Talking Points:
- Crude oil prices struggle despite OPEC/Russia jawboning, JODI data ahead
- Gold prices may find support as US government shutdown sours sentiment
- What are the forces driving long-term crude oil price trends? Find out here
Crude oil prices are finding no support in headlines suggesting OPEC and Russia may continue to coordinate production efforts beyond the current supply cut scheme expiring at the end of the year. That’s after the IEA said it expects “explosive” US production growth on Friday. Incoming JODI data on global exports and output trends may help tip scales one way of another, at least in the near term.
Meanwhile, gold prices are curiously under pressure even as the ongoing US government shutdown weighs on sentiment, pressuring bond yields downward. That might have been expected to lift the standard-bearer for non-interest-bearing assets. FTSE 100 and S&P 500 index futures are pointing lower before London and New York come online however, hinting a bounce may yet materialize if risk aversion gains momentum.
What do retail traders’ bets suggest about gold price trends? Find out here !
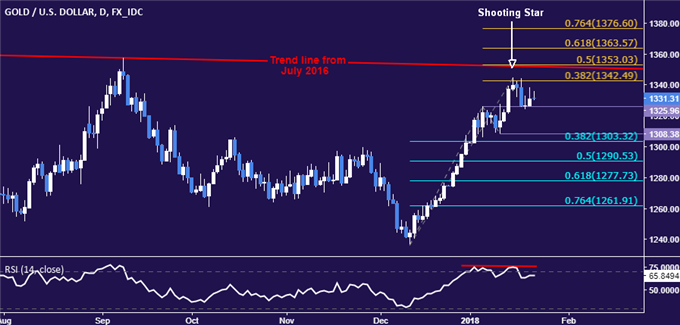
GOLD TECHNICAL ANALYSIS – Gold prices turned lower after producing a Shooting Star candlestick coupled with negative RSI divergence, as expected. From here, a move below resistance-turned-support at 1325.96, the January 4 high, exposes the 1303.32-08.38 area (38.2% Fibonacci retracement, January 10 low). Alternatively, a push above the 38.2% Fib expansion at 1342.49 targets 1353.03 (trend line, 50% level).

Chart created using TradingView
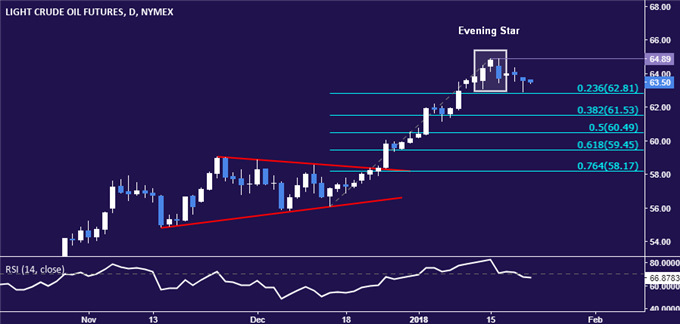
CRUDE OIL TECHNICAL ANALYSIS – Crude oil prices edged lower after putting in a bearish Evening Star candlestick pattern but a confirmed reversal remains elusive for now. Breaking below the 23.6% Fibonacci retracement at 62.81 on a daily closing basis exposes the 38.2% level at 61.53. Near-term resistance remains at 64.89, the January 15 high.

Chart created using TradingView
--- Written by Ilya Spivak, Currency Strategist for DailyFX.com
To receive Ilya's analysis directly via email, please SIGN UP HERE
Contact and follow Ilya on Twitter: @IlyaSpivak


