


Talking Points:
- Crude oil prices recoil lower after testing former chart support
- Gold prices edge up amid prepositioning for Fed rate decision
- EIA inventory data, FOMC 2018 rate hike outlook now in focus
Crude oil prices fell as the US Department of Energy upgraded its 2018 production forecast while downgrading demand expectations. Meanwhile, API inventory data revealed an outsized drop in crude stockpiles (-2.7 m/b) but paired it with a larger build in refined product storage compared with what is expected from upcoming EIA statistics. If these mirror the API result, deeper losses may follow.
Gold prices edged higher as the US Dollar pulled back alongside Treasury bond yields, boosting the relative appeal of non-interest-bearing and anti-fiat assets. The move appears to reflect pre-positioning ahead of the upcoming FOMC announcement. The yellow metal may face renewed selling pressure if Chair Janet Yellen and company opt to stand by September’s rate hike forecast envisioning three increases in 2018.
Retail traders expect gold to rise. Find out here what this hints about actual on-coming price trends!
GOLD TECHNICAL ANALYSIS – Gold prices paused to digest after setting yet another multi-month low. The next layer of support remains at 1232.16, the 76.4%Fibonacci expansion, with a daily close below that exposing the 100% level at 1209.34. Alternatively, a move back above the 61.8% Fibat 1246.28 paves the way for a retest of former support marked by the October 6 lowat 1260.80.
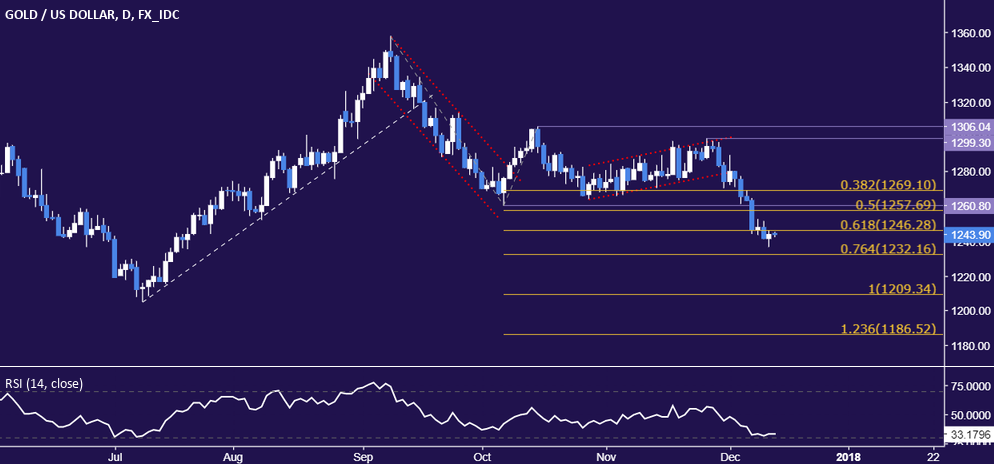
Chart created using TradingView
CRUDE OIL TECHNICAL ANALYSIS – Crude oil prices recoiled downward after a retest of trend line support-turned-resistance established form early October, painting recent gains as corrective in the context of a broader down move. From here, a daily close below the 38.2% Fibonacci retracement at 55.04 targets the 50% level at 54.08. Alternatively, a move above the 23.6% Fib expansion at 59.83 opens the door for a challenge of the the 38.2% barrier at 62.31.
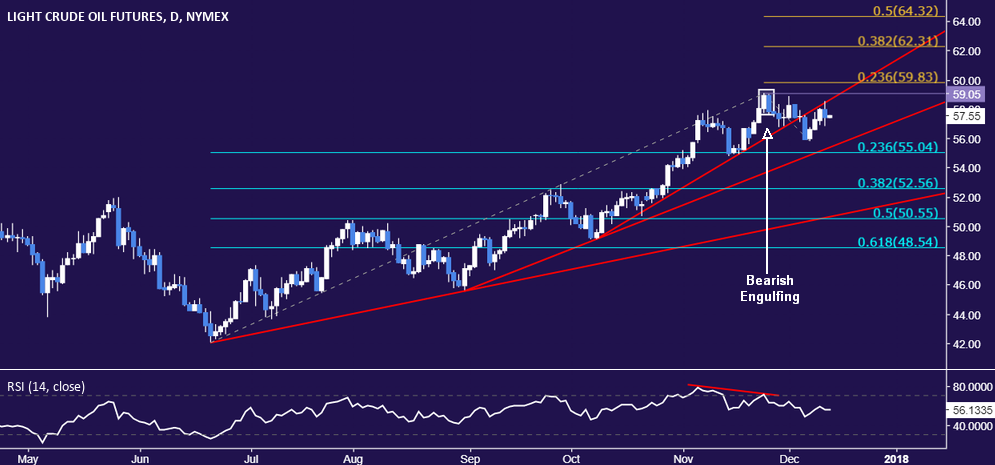
Chart created using TradingView
--- Written by Ilya Spivak, Currency Strategist for DailyFX.com
To receive Ilya's analysis directly via email, please SIGN UP HERE
Contact and follow Ilya on Twitter: @IlyaSpivak


