


Talking Points:
- Crude oil prices sink as IEA cuts demand outlook, API reports inventory rise
- Gold prices might look past US CPI data to focus on US tax reform potential
- How are our Q4 crude oil and gold price forecasts holding up? Find out here
Crude oil prices sank, suffering the largest daily loss in two months, after the IEA lowered its demand outlook and predicted a firm new floor has not been established. This was followed by API inventory data that revealed a shocking 6.5 billion inflow into US storage last week.
The spotlight now turns to EIA inventory data, where a 1.8 million barrel drawdown is expected. A result that registers closer to the API estimate may engineer another lunge downward. Reports that OPEC is struggling to convince Russia to participate in an output cut extension might compound selling pressure.
Gold prices continued to mark time in familiar territory. October’s US CPI statistics are now in focus, with expectations pointing to a slowdown in the year-on-year inflation rate. Traders might look past the report to focus on prospects for US tax reform however.
Retail traders expect gold to rise. Find out here what this hints about actual price trends!
GOLD TECHNICAL ANALYSIS – Gold prices remain stuck within the narrowing bounds of a would-be Triangle chart pattern. The setup’s bearish implications would be activated on a close below 1272.01, the intersection of the 38.2% Fibonacci expansion and the Triangle floor. That would initially expose the 1260.80-61.50 area (October 6 low, 50% level). Alternatively, a move above the Triangle top – now at 1294.10 – paves the way for another challenge of the October 16 high at 1306.04.
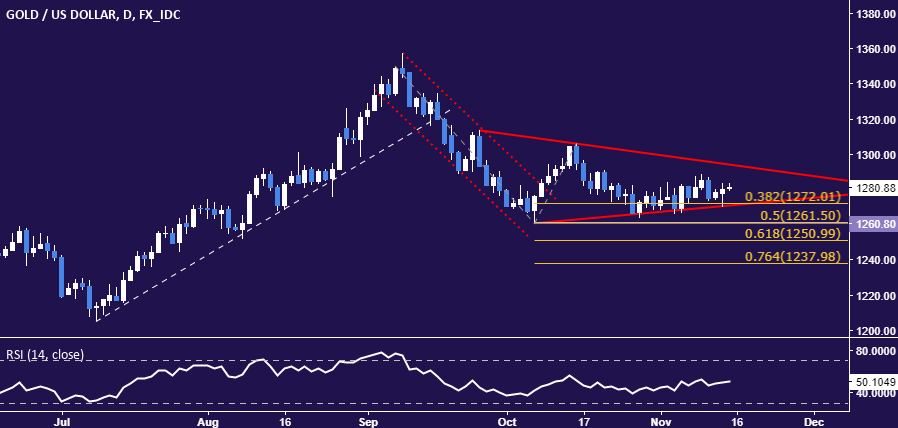
Chart created using TradingView
CRUDE OIL TECHNICAL ANALYSIS – Crude oil prices turned sharply lower to test support at 55.01, the 23.6% Fibonacci retracement. A daily close below that exposes the 38.2% level at 53.21. Alternatively, a move back above the 14.6% Fib at 56.12 opens the door for a retest of the November 8 high at 57.92.
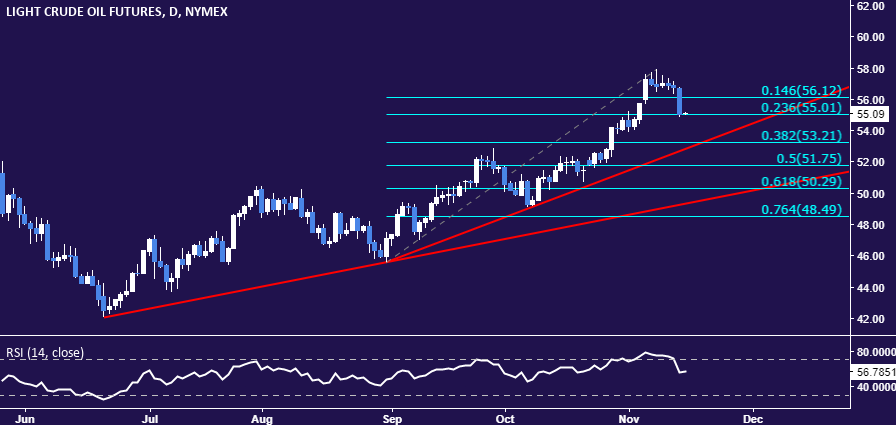
Chart created using TradingView
--- Written by Ilya Spivak, Currency Strategist for DailyFX.com
To receive Ilya's analysis directly via email, please SIGN UP HERE
Contact and follow Ilya on Twitter: @IlyaSpivak


