


Talking Points:
- Crude oil prices may continue to rise as risk appetite brightens
- Gold prices may bounce following as-expected FOMC outcome
- Where will commodities trade at year-end? See our forecasts
Crude oil prices rose after an EIA report showed US output fell 0.3 percent while gasoline consumption rose to a record 9.77 million barrels per day in August. An API report showing crude stockpiles shed 5.09 million barrels last week – a far larger drop than the 877.25k drawdown expected to emerge in today’s official DOE statistics – was likely helpful as well.
Prices may not be particularly responsive if the government’s accounting of storage outflows hews closer to that of API having already capitalized on its implications to some extent. That might see sentiment trends re-asserting their dominance. S&P 500 futures are pointing higher, hinting that the cycle-sensitive commodity might extend its advance against a broadly risk-on backdrop.
Gold prices declined as the US Dollar rose against most of its major counterparts and front-end Treasury bond yields gained ground, tarnishing the appeal of non-interest-bearing and anti-fiat assets. The move came against a backdrop of firming Fed rate hike bets and may have reflected pre-positioning ahead of the upcoming FOMC policy announcement, which is widely expected to set the stage for tightening in December.
Priced-in policy bets implied in Fed Funds futures put the probability of a rate hike at the year’s last meeting of the policy-setting committee at a hefty 97 percent. An outcome that investors deem “hawkish” in this context seems like a more difficult proposition than a “dovish” one. With that in mind, the yellow metal might manage something of a recovery in its aftermath.
Retail traders are betting on gold gains. Find out here what this hints about on-coming price moves.
GOLD TECHNICAL ANALYSIS – Gold prices are still trying to negotiate support in the 1266.44-69.10 area (October 5 low, 38.2% Fibonacci expansion). A daily close below it exposes the 50% levelat 1257.69. Alternatively, a move above support-turned-resistance at 1277.16 opens the door for a retest of 1291.06, the October 20 high.
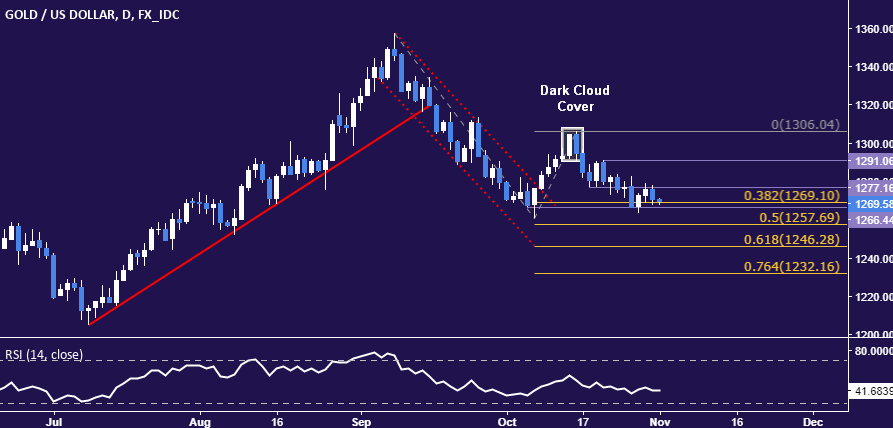
Chart created using TradingView
CRUDE OIL TECHNICAL ANALYSIS – Crude oil prices broke above the 50% Fibonacci expansion at 54.51, opening the door for a challenge of the 61.8% level at 55.78. A further push beyond that aims for the 76.4% Fib at 57.36. Alternatively, a turn back below 54.51 clears the way for a retest of the 52.86-53.23 area (38.2% expansion, September 28 high).

Chart created using TradingView
--- Written by Ilya Spivak, Currency Strategist for DailyFX.com
To receive Ilya's analysis directly via email, please SIGN UP HERE
Contact and follow Ilya on Twitter: @IlyaSpivak


