Talking Points:
- Gold prices rise on phased-in US tax cut proposal, Mueller indictments
- Crude oil prices digest gains after rising to the highest in eight months
- EIA monthly report and API inventory data ahead, politics a wildcard
Gold prices edged up as 2018 Fed rate hike prospects cooled amid reports that tax cuts favored by Congressional Republicans and the Trump administration may be phased in over several years rather than activated outright. That undermined bets on an inflationary fiscal push that forces the US central bank into a steeper tightening cycle, offering a lift to anti-fiat assets epitomized by the yellow metal.
News of the first indictments in Special Counsel Robert Mueller’s investigation into possible links between the Trump presidential campaign and Russia may have helped. Traders might have reckoned that it could be tough for the President and like-minded lawmakers to get meaningful legislation off the ground by year-end as Mr Mueller’s efforts gain momentum.
Looking ahead, a tame offering on US economic calendar and the proximity of the FOMC monetary policy announcement may translate into muted trade. Political jitters remain a wildcard however. Another bombshell from Washington DC may yet sour risk appetite, pressuring bond yields lower. Needless to say, the benchmark for non-interest-bearing assets is likely to find support in this scenario.
Crude oil prices marked time, jostling in familiar territory but ultimately failing to find clear-cut direction. An EIA monthly report on US production trends as well as API weekly inventory flow data are now in focus. The latter will be weighed up against government statistics due Wednesday that are expected to show that stockpiles shed 1.48 million barrels last week.
What are the fundamental forces driving long-term crude oil price trends? Find out here !
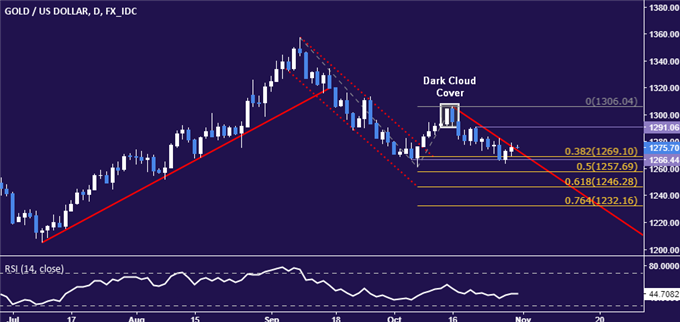
GOLD TECHNICAL ANALYSIS – Gold prices continue to mark time above support in the 1266.44-69.10 area (October 5 low, 38.2% Fibonacci expansion). Breaking below this barrier on a daily closing basis sees the next downside barrier at 1257.69, the 50% level. Key resistance is marked by the October 20 high at 1291.06, followed by the October 16 peak at 1306.04.

Chart created using TradingView
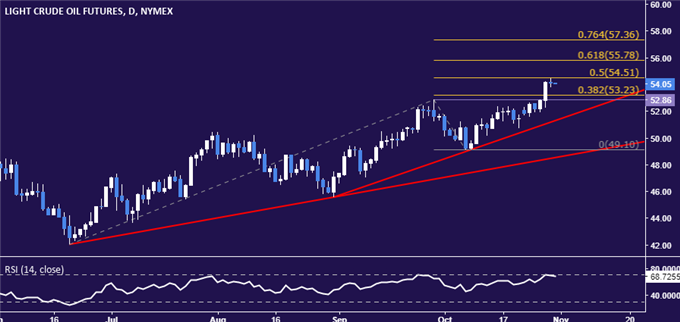
CRUDE OIL TECHNICAL ANALYSIS – Crude oil prices paused to digest gains after hitting an eight-month high. From here, a daily close above the 50% Fibonacci expansion at 54.51 exposes the 61.8% level at 55.78. Alternatively, a turn back below the September 28 high at 52.86 – now recast as support – opens the door for a test of a rising trend line at 51.36.

Chart created using TradingView
--- Written by Ilya Spivak, Currency Strategist for DailyFX.com
To receive Ilya's analysis directly via email, please SIGN UP HERE
Contact and follow Ilya on Twitter: @IlyaSpivak


