


Talking Points:
- Gold prices bounce from post-NFP drop as risk appetite sours on Wall St.
- Crude oil prices fall on Libya output, updated path for tropical storm Nate
- What will determine commodity price trends in Q4? Get our forecasts here
Gold prices were taken on a wild ride Friday, falling to a two-month low as US labor-market data stoked Fed rate hike speculation (as expected) only to promptly reverse course higher to finish the day with the biggest gain in almost two weeks. The bounce came as risk appetite soured, pushing the benchmark S&P 500 stock index to its first loss in eight sessions and weighing on bond yields.
Crude oil prices plunged as Libya promptly restarted the Shahara oil field – its largest – after yet another shutdown. Meanwhile, an update on the path of tropical storm Nate suggested it will veer away from critical production infrastructure along the Gulf Coast. This hinted that disruptions akin to those caused by hurricanes Harvey and Irma over the past two months will not be repeated.
From here, the Columbus Day holiday will make for an empty US data docket despite the markets being open. That will might make for a consolidate day for gold prices, with a pullback possible as US equity futures cautiously hint at corrective gains following Friday’s decline. As for oil, comments from industry bigwigs from the sidelines of the India Energy Forum are in focus.
What do retail traders buy/sell decisions hint about on-coming gold price moves? Find out here !
GOLD TECHNICAL ANALYSIS – Gold prices are edging up to test resistance guiding one-month down move, a barrier reinforced by the 50% Fibonacci retracement at 1281.26. A daily close above that exposes the 23.6% Fib expansion at 1296.79. Alternatively, a move below the 61.8% retracement at 1263.27 targets the 76.4% level at 1241.01.
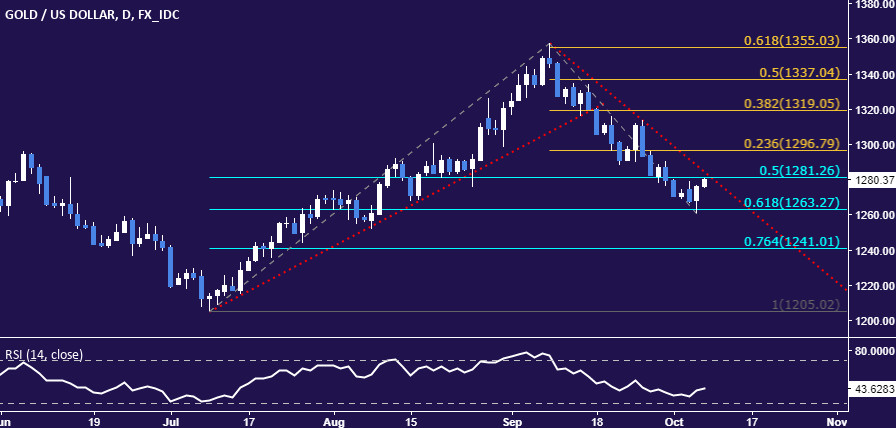
Chart created using TradingView
CRUDE OIL TECHNICAL ANALYSIS – Crude oil prices are aiming to test support at 48.72, the 38.2% Fibonacci retracement, after suffering the largest daily drop in a month. A breach below this barrier confirmed on a daily closing basis targets the 50% level at 47.46. Alternatively, a move back the October 4 low at 49.80 – now recast as resistance – opens the door for a retest of the October 5 high at 51.20.

Chart created using TradingView
--- Written by Ilya Spivak, Currency Strategist for DailyFX.com
To receive Ilya's analysis directly via email, please SIGN UP HERE
Contact and follow Ilya on Twitter: @IlyaSpivak


