


Talking Points:
- Crude oil prices hit 4-month high on OPEC output cuts, EIA data
- Gold prices plunge as FOMC stands by 2017-18 rate hike outlook
- A lull in top-tier event risk may translate into near-term digestion
Crude oil prices pushed upward after a brief consolidative pause, hitting a four-month high. The technical committee monitoring OPEC-led production cuts said joint compliance registered at an impressive 116 percent in August and Iraq hinted a further 1 percent reduction in production is being discussed (though Russia pushed back a bit, saying no formal proposal has been made).
EIA inventory statistics also helped. The report showed a bigger crude oil storage build than markets were looking for but gasoline and distillate stockpiles fell significantly more than expected. This hinted that hurricane-related refining capacity disruption was fading faster than many feared, meaning that the unwinding of a glut in raw product can commence with gusto relatively sooner.
Gold prices plunged after the Federal Reserve opted to keep forecasts for the rate hike path through 2018 unchanged from June’s assessment, as expected. A slight downgrade of the 2019 projection appeared to be too distant to be bothersome. The US Dollar rose alongside Treasury bond yields, undermining the appeal of anti-fiat and non-interest-bearing assets epitomized by the yellow metal.
Looking ahead, a lull in top-tier scheduled event risk might make for a period of digestion. That need not mean that follow-on moves from yesterday’s price action are unlikely, but momentum might slow to some extent. The absence of an unambiguous focal point might also make markets particularly headline-sensitive, elevating knee-jerk volatility risk.
What is the #1 mistake that traders make, and how can you fix it? Find out here !
GOLD TECHNICAL ANALYSIS – Gold prices accelerated lower, pressuring support in the 1295.46-99.25 area (38.2% Fibonacci retracement, double top). A daily close below that exposes the 50% level at 1281.26. Alternatively, a move back above the 23.6% Fib at 1321.51 targets the 14.6% retracement at 1335.24.
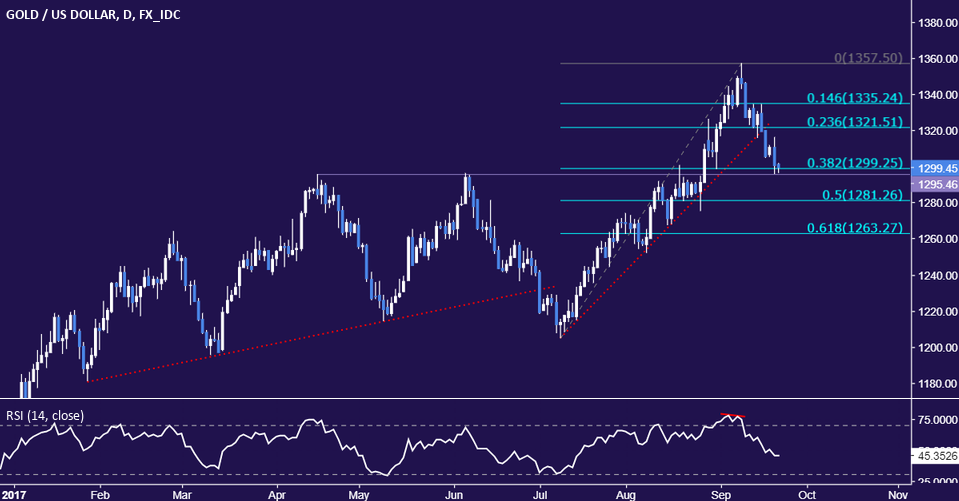
Chart created using TradingView
CRUDE OIL TECHNICAL ANALYSIS – Crude oil prices pushed past resistance marked by the August 1 highat 50.40 to expose the May 25 top at 51.97. A further push beyond that targets the 53.74-54.48 area. Alternatively, a turn back below 50.40 opens the door for a retest of the September 6 high at 49.49. Trend line resistance-turned-support follows at 48.96.
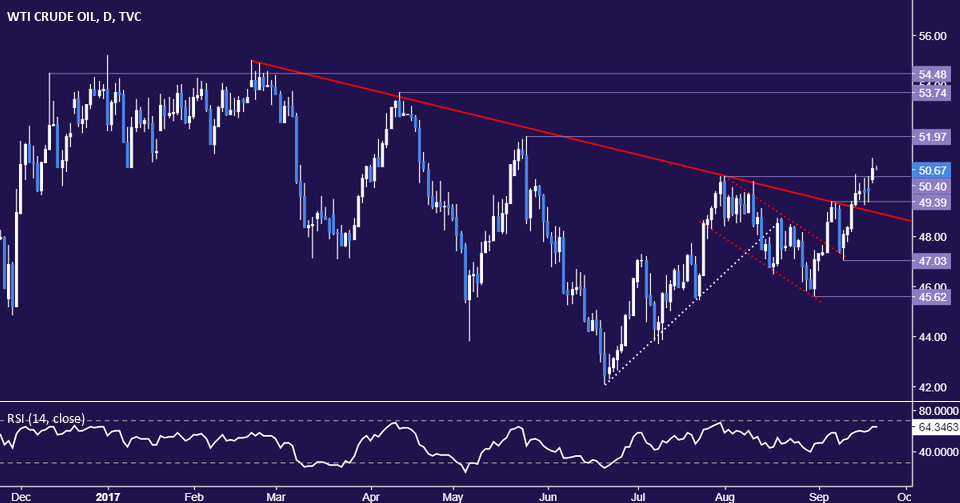
Chart created using TradingView
--- Written by Ilya Spivak, Currency Strategist for DailyFX.com
To receive Ilya's analysis directly via email, please SIGN UP HERE
Contact and follow Ilya on Twitter: @IlyaSpivak


