


Talking Points:
- Crude oil prices drop, seemingly correcting after Friday’s surge
- Gold prices rise amid pre-positioning for Friday’s Yellen speech
- API inventory flow report, Trump rally in Arizona now in focus
Crude oil prices dropped even as Libya halted delivers from the Shahara field, its largest. Compliance with the OPEC-led production cut accord reportedly weakened to 94 percent in July from 98 percent in the prior month, but that tidbit crossed the wires hours after the WTI benchmark set its session high and began to sink. On balance, it seems the suggest losses were corrective after Friday’s aggressive upswing.
Gold prices rose as US Treasury bond yields and the US Dollar weakened, boosting the relative appeal of non-interest-bearing and anti-fiat assets. The move echoes softening of Fed rate hike expectations, with the priced-in probability of another increase in 2017 down from 36 to 32.5 percent. A single catalyst for the shift is not readily apparent however, hinting at pre-positioning for this week’s Yellen speech as the culprit.
Looking ahead, crude oil traders will focus on inventory flow data from API. It will be measured against the 3.2 million barrel draw expected to be seen in official EIA figures on Wednesday. A larger outflow is likely to push prices higher, and vice versa. As for gold, it may struggle to find follow-through but – as ever – the influence of US politics is a wildcard as President Trump holds a rally in Arizona.
Retail traders expect gold to rise. Find out here what this hints about where prices may actually go!
GOLD TECHNICAL ANALYSIS – Gold prices remain stuck below resistance in the 1295.46-1300.46 area (double top, 38.2% Fibonacci expansion), with negative RSI divergence warning that a turn lower may be ahead. A daily close below 1267.21 (August 15 low, trend line) exposes the 38.2% Fib retracement at 1258.82. Alternatively, a push through resistance targets the 50% expansion at 1310.74.
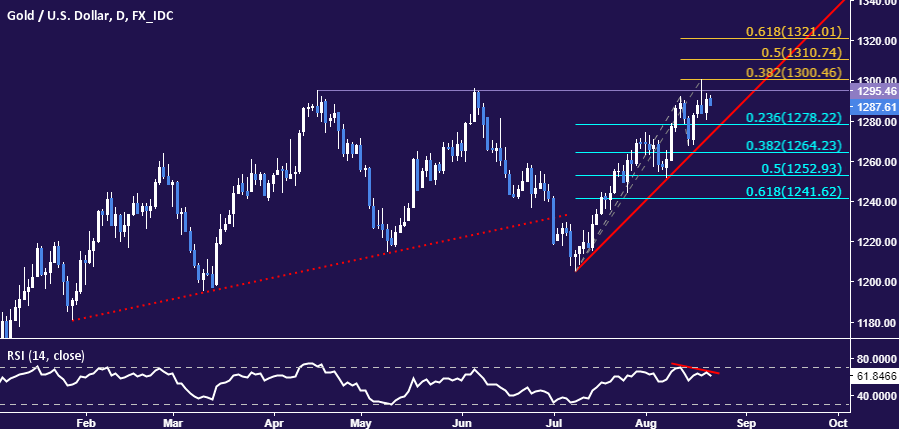
Chart created using TradingView
CRUDE OIL TECHNICAL ANALYSIS – Crude oil prices recoiled from support-turned-resistance at 48.76 (range floor, trend line), hinting the near-term bearish bias remains intact. From here, a daily close below the 38.2% Fibonacci expansion at 46.62 exposes the 50% level at 45.46. Alternatively, a breach of resistance paves the way for a retest of the August 1 high at 50.40.
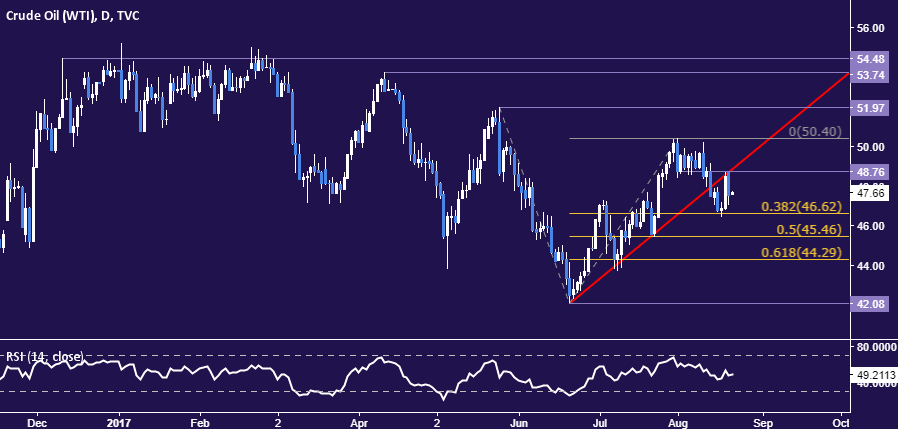
Chart created using TradingView
--- Written by Ilya Spivak, Currency Strategist for DailyFX.com
To receive Ilya's analysis directly via email, please SIGN UP HERE
Contact and follow Ilya on Twitter: @IlyaSpivak


