


Talking Points:
- Gold prices rejected at 8-month high, eyeing Jackson Hole symposium
- Crude oil prices jump as physical market spreads show signs of strength
- OPEC/non-OPEC committee to grade compliance with output cut deal
Gold prices briefly touched an eight-month high but swiftly retreated as markets cheered the removal of controversial Trump advisor Steve Bannon. The move followed the administration’s broadly panned response to recent events in Charlottesville, Virginia. Bond yields rose alongside share prices, undermining the appeal of non-interest-bearing assets including the yellow metal.
Crude oil prices surged as the markets’ attention to signs of strength in spreads between spot prices for various grades of product and futures-market benchmarks such as WTI and Brent. These suggested that the physical market might be signaling a more favorable demand picture, even looking beyond the seasonal pickup typically associated with the summer months.
From here, energy markets will focus on a meeting of the OPEC/non-OPEC Joint Technical Committee in Vienna is in focus as producers take stock of compliance with the cartel-led production cut accord. As for gold, it might struggle to find lasting direction in the near term, with investors probably unwilling to commit until headlines from the Fed conference in Jackson Hole, Wyoming start to emerge.
What fundamental forces drive crude oil price trends? Find out here !
GOLD TECHNICAL ANALYSIS – Gold prices were continue to hover below trend-defining resistance in the 1295.46-1300.46 area (double top, 38.2% Fibonacci expansion). Breaking this barrier on a daily closing basis exposes the 50% level at 1310.74. Alternatively, a reversal below 1267.21 (August 15 low, trend line) targets the 38.2% Fib retracement at 1258.82. Negative RSI divergence warns of ebbing upside momentum, arguing in favor of a downside scenario.
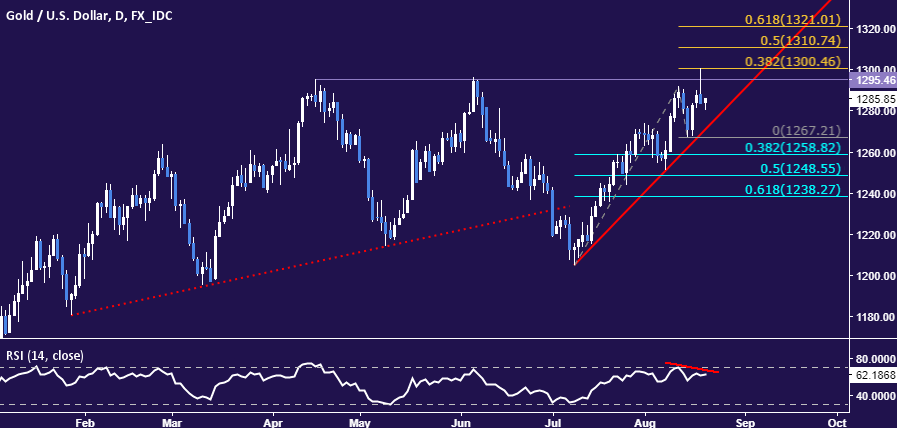
Chart created using TradingView
CRUDE OIL TECHNICAL ANALYSIS – Crude oil prices shot sharply higher, posting the largest daily increase in a month. From here, a daily close above the 38.2% Fibonacci expansion at 49.62 opens the door for a test of the 50% level at 50.60. Alternatively, a move back below the 23.6% Fib at 48.40 exposes the 14.6% expansion at 47.65 anew.

Chart created using TradingView
--- Written by Ilya Spivak, Currency Strategist for DailyFX.com
To receive Ilya's analysis directly via email, please SIGN UP HERE
Contact and follow Ilya on Twitter: @IlyaSpivak


