


Talking Points:
- Crude oil prices eye support below $46 after sharp selloff
- Gold prices range-bound despite risk-driven yields decline
- UofM, CFTC and Baker Hughes data may fall on deaf ears
Crude oil prices marked time on Thursday as a lull in top-tier news flow allowed the WTI benchmark to digest losses following the prior day’s fireworks. The stock of scheduled event risk remains tame through the end of the week, with CFTC futures positioning data and Baker Hughes rig count statistics due to cross the wires. That might make for a consolidative tone until fresh fodder emerges next week.
Competing influences triggered by the unwinding of the “Trump trade” left gold prices range-bound. Stocks swooned as confidence in the US President’s ability to execute a pro-growth agenda fizzled. Treasury bond yields followed, which might’ve been expected to boost the yellow metal. A corrective bounce in the US Dollar after Wednesday’s plunge dashed those hopes however.
A gauge of US consumer confidence from the University of Michigan is now in focus. That is expected to show that sentiment improved in August after sliding to a nine-month low in July. An outcome echoing broad improvement in US economic news-flow since mid-June may have bolstered Fed rate hike prospects under normal circumstances but the risk-off mood prevailing around markets might make that unlikely.
What is the #1 mistake that traders make and how can you fix it? Find out here !
GOLD TECHNICAL ANALYSIS – Gold prices continue to hover below trend-defining resistance in the 1295.46-1300.46 area (double top, 38.2% Fibonacci expansion). A daily close above that opens the door for a test of the 50% level at 1310.74. Alternatively, a turn below 1267.21 (August 15 low, trend line) exposes the 38.2% Fib retracement at 1258.82.
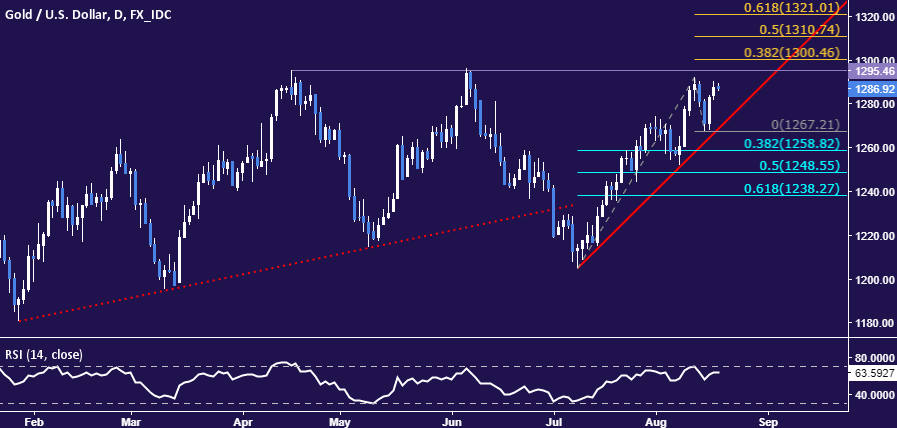
Chart created using TradingView
CRUDE OIL TECHNICAL ANALYSIS – Crude oil prices paused to digest losses after hitting the lowest level in three weeks. Near-term support is at 45.38, the 38.2% Fibonacci expansion, with a daily close below that exposing the 50% level at 43.83. Alternatively, a move back above the 23.6% Fib at 47.30 targets 48.48 (14.6% expansion, trend line).

Chart created using TradingView
--- Written by Ilya Spivak, Currency Strategist for DailyFX.com
To receive Ilya's analysis directly via email, please SIGN UP HERE
Contact and follow Ilya on Twitter: @IlyaSpivak


