


Talking Points:
- Gold prices rise on Trump break with business leaders, FOMC minutes
- Crude oil prices drop as markets focus on gasoline, distillate inventories
- Are commodities matching DailyFX forecast so far in Q3? Find out here
Gold prices rose as Fed rate hike expectations fizzled after US President Donald Trump broke with business leaders advising him via the Strategic and Policy Forum as well as the Manufacturing Council following his response to recent turmoil in Charlottesville, Virginia.
The news tarnished hopes that the nascent Republican administration will be able to deliver on a pro-business agenda including infrastructure spending, deregulation and corporate tax cuts. Those policies were expected to boost inflation and push the central bank into a steeper tightening cycle.
Minutes from July’s FOMC policy meeting likewise hurt the case for spirited stimulus withdrawal. The document highlighted concerns about sluggish inflation and cited fiscal policy uncertainty as a headwind, which played into the day’s already worrisome news-flow from Washington DC.
Crude oil prices shrugged off EIA data showing an 8.95 million barrel inventory drawdown. The outcome was well-telegraphed by API figures published yesterday, seemingly putting the spotlight on unexpected builds in gasoline and distillate stockpiles instead.
Need help understanding what drives crude oil price moves? Check our guide here !
GOLD TECHNICAL ANALYSIS – Gold prices bounced from rising trend line support set from July swing lows. From here, a daily close above the 1295.46-1300.46 area (double top, 38.2% Fibonacci expansion) exposes the 50% level at 1310.74. Alternatively, a reversal below 1267.21 (August 15 low, trend line) targets the 38.2% Fib retracement at 1258.82.
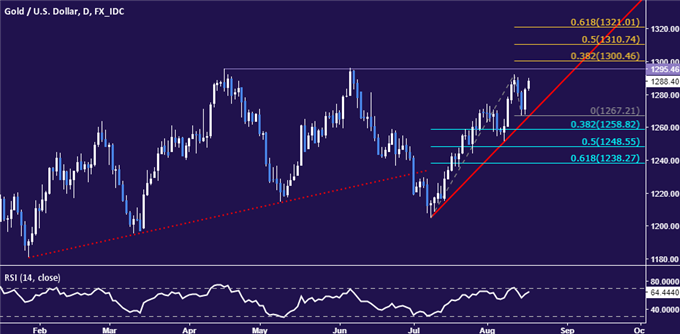
Chart created using TradingView
CRUDE OIL TECHNICAL ANALYSIS – Crude oil prices continued to push lower following a brief consolidative pause. A daily close below the 38.2% Fibonacci expansion at 45.38 targets the 50% level at 43.83. Alternatively, a reversal back above the 23.6% Fib at 47.30 opens the door for a retest of 48.48 (14.6% expansion, trend line).
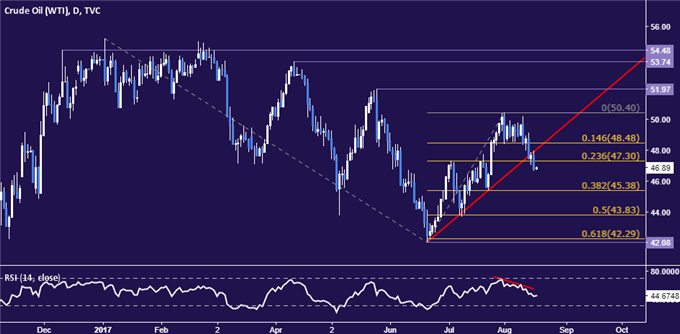
Chart created using TradingView
--- Written by Ilya Spivak, Currency Strategist for DailyFX.com
To receive Ilya's analysis directly via email, please SIGN UP HERE
Contact and follow Ilya on Twitter: @IlyaSpivak


