


Talking Points:
- Crude oil prices whipsaw as Libya restarts Shahara field, OPEC/NOPEC meet
- Gold prices shrug off tame Fed commentary, looking ahead to US inflation data
- Are commodity price trends matching our forecasts so far in Q3? Find out here
Crude oil prices seesawed but failed to find lasting direction. The WTI benchmark fell as Libya restarted its Shahara oil field after it was briefly shut down by protestors. The country is exempt from the OPEC-led production cut scheme and its growing output has bedeviled participants’ efforts at rebalancing the market.
Prices swiftly recovered however as all eyes returned to Abu Dhabi, where a meeting of the cartel and its allies is eyed for signs of agreement on larger output reduction. News-flow from the gathering as well as the weekly set of API inventory flow figures and a short-term outlook report from the EIA are now in focus.
Gold prices marked time in a narrow consolidation range, digesting losses sustained after Friday’s upbeat US jobs report. Traders were uninspired by broadly status-quo comments from St Louis and Minneapolis Fed presidents Jim Bullard and Neel Kashkari.
Both policymakers fall on the dovish side of the FOMC spectrum and delivered accordingly without sounding any more forceful than before. A lull in top-tier news-flow may see the standstill continue in the near term as investors brace for Friday’s US CPI report.
What do retail traders’ buy/sell decisions say about gold price trends? Find out here !
GOLD TECHNICAL ANALYSIS – Gold prices paused to digest losses above support marked by the 23.6% Fibonacci expansion at 1252.62. A daily close below this barrier opens the door for a challenge of the 38.2% level at 1239.33. Alternatively, a reversal back above chart inflection point resistance at 1260.85 targets the August 1 high at 1274.11 anew.

Chart created using TradingView
CRUDE OIL TECHNICAL ANALYSIS – Crude oil prices are still locked in a now-familiar range below resistance at 50.19, the 61.8% Fibonacci retracement. A push above this barrier confirmed on a daily closing basis exposes the 76.4% level at 52.11. Alternatively, a turn below the 50% Fib at 48.65 paves the way for a retest of the 47.10-29 area (38.2% Fib, July 4 high, trend line).
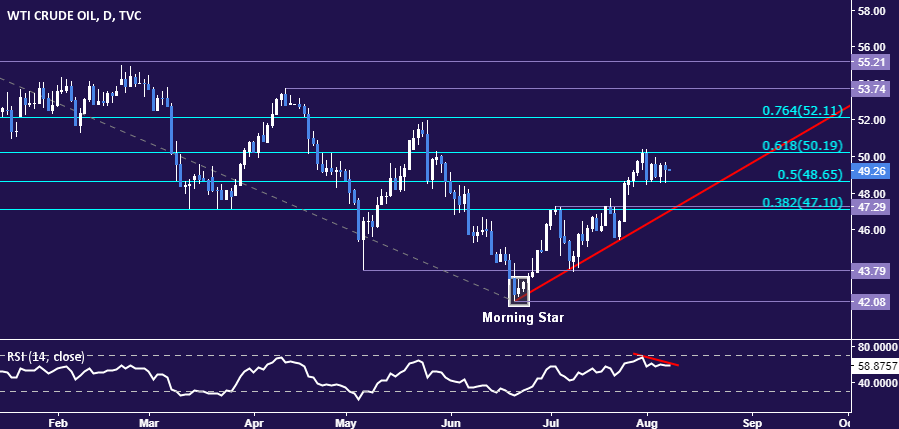
Chart created using TradingView
--- Written by Ilya Spivak, Currency Strategist for DailyFX.com
To receive Ilya's analysis directly via email, please SIGN UP HERE
Contact and follow Ilya on Twitter: @IlyaSpivak


