


Talking Points:
- Gold prices aim at key chart resistance as Day 2 of Yellen testimony looms
- Crude oil prices may take cues from sentiment trends amid event risk lull
- Will gold and crude oil rise or fall in the next 3 months? See our forecasts
Gold prices rose after markets concluded that Fed Chair Janet Yellen adopted a dovish posture in testimony before a House of Representatives panel yesterday. She seemed wary of recently slowing inflation and suggested that rates won’t need to rise much further to get to a neutral setting. That sent the US Dollar lower alongside Treasury bond yields, boosting the appeal of anti-fiat and non-interest-bearing assets.
The second round of testimony is now in focus, with Yellen offering a repeat performance in the Senate. Her prepared remarks will almost certainly follow a familiar script but the subsequent Q&A session may offer new insights. Having seen the markets’ reaction yesterday, she may use this opportunity to walk back some of the “dovishness” perceived by traders insomuch as the Fed still expects to raise rates a third time this year.
Crude oil prices shrugged off a larger-than-expected weekly inventory drawdown to focus on output levels. EIA reported stockpiles shed 7.56 million barrels last week, a far larger draw than the 2.26 million barrel one projected by analysts. The result was well-telegraphed by the preceding day’s API estimate however. Instead, markets focused on output hitting the highest level since July 2015, which sent prices lower.
With the IEA monthly report having now passed without significant incident, oil traders are left without obvious catalysts from scheduled event risk. That may see the WTI benchmark fall in with broader risk appetite trends. S&P 500 futures are pointing to a risk-on mood ahead, though that may quickly change to the detriment of crude oil prices if Yellen backtracks on yesterday’s remarks.
Have a question about trading commodities? Sign up for a webinar and ask it live!
GOLD TECHNICAL ANALYSIS – Gold prices are poised to test the top of a falling channel guiding the down trend since early June and reinforced by the 23.6%Fibonacci retracementat 1226.26.A daily close above that exposes the 38.2% level at 1239.60. Alternatively, a reversal back below the 14.6% Fib at 1218.04 targets the July 10 low at 1204.70.

Chart created using TradingView
CRUDE OIL TECHNICAL ANALYSIS – Crude oil prices are testing below chart inflection point support at 45.32. A daily close back below this barrier exposes the May 5 low at 43.79 anew. Alternatively, a push above the 38.2% Fibonacci retracement at 47.10 paves the way for a challenge of the 50% level at 48.65.
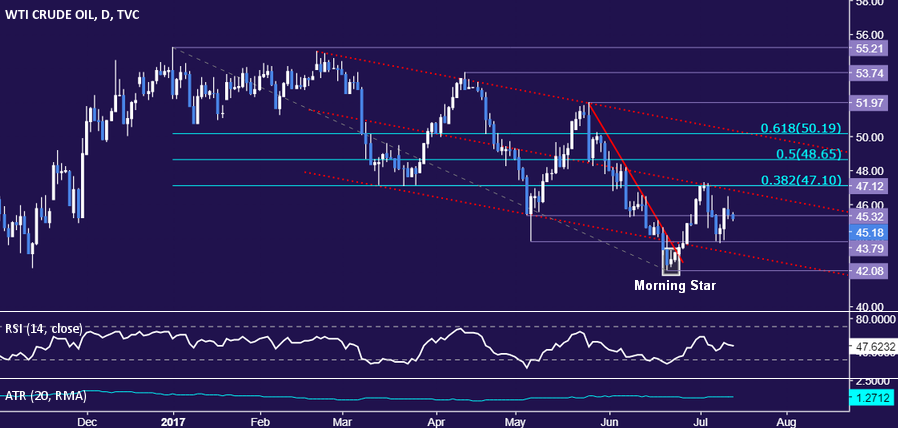
Chart created using TradingView
--- Written by Ilya Spivak, Currency Strategist for DailyFX.com
To receive Ilya's analysis directly via email, please SIGN UP HERE
Contact and follow Ilya on Twitter: @IlyaSpivak


