


Talking Points:
- Crude oil prices rise as EIA trims US output bet, API reports large inventory drop
- Gold prices edge higher before Yellen speech, may retreat on hawkish commentary
- What will drive crude oil and gold trends in the next 3 months? See our forecasts
Crude oil prices suffered intraday amid reports that Saudi Arabia breached the output quota it agreed to as part of the OPEC-led production cut effort. The move quickly fizzled however as the markets braced for the release of and updated EIA short-term energy outlook and API inventory flow statistics.
The cautious tone proved prescient. The EIA downgraded its forecast for US production and API said inventories lost 8.13 million barrels last week, a drawdown well in excess of 2.26 million outflow expected by investors. The WTI benchmark responded with the largest daily gain in two weeks.
From here, official DOE inventory figures as well as the OPEC monthly report are on tap. The World Petroleum Congress taking place in Istanbul may also generate market-moving commentary, especially if the cartel-led group of top producers hint they are open to reducing output further.
Gold prices corrected higher ahead of two days of much-anticipated Congressional testimony from Fed Chair Janet Yellen. Her remarks may prove decisive in closing the gap between the central bank’s policy expectations and those of the markets.
The rate-setting FOMC committee envisions one more rate hike this year. Investors are dubious, putting chance of another increase in 2017 at just 48 percent. Much this skepticism seems based on recently softening inflation, which the Fed maintains is temporary.
Recent economic data suggests there is some merit to the Fed’s argument. With that in mind, Yellen may use the testimony to make her case for further tightening. If she is sufficiently convincing, a hawkish shift in the markets’ baseline outlook is likely to push gold prices lower.
Need help turning commodities news into an actionable strategy? Check out our trading guide.
GOLD TECHNICAL ANALYSIS – Gold prices are attempting a rebound after testing the lower boundary of the down trend in play since early June. A daily close above the 14.6% Fibonacci retracement at 1218.04 targets the 23.6% level at 1226.26. Alternatively, a reversal below the 23.6% Fib expansion at 1210.86 exposes the 38.2% threshold at 1199.41.
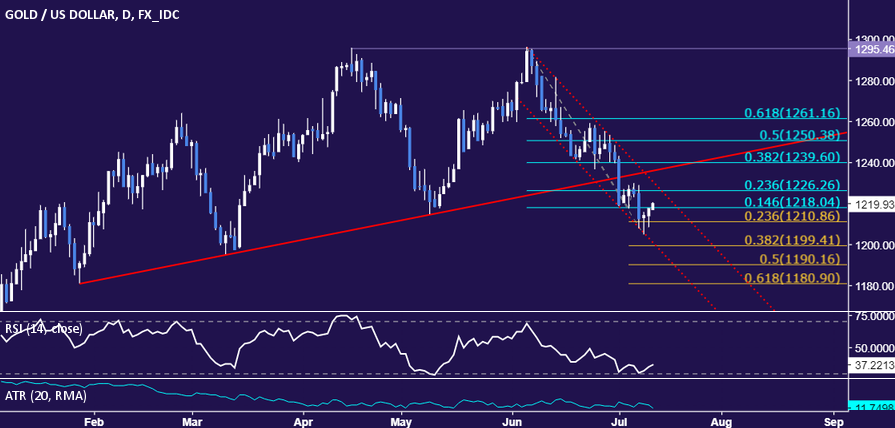
Chart created using TradingView
CRUDE OIL TECHNICAL ANALYSIS – Crude oil prices have reclaimed a foothold above the chart inflection point at 45.32, opening the door for another test of the 38.2% Fibonacci retracement at 47.10. Alternatively, a move back below 45.32 – now recast as support once again – exposes the May 5 low at 43.79.

Chart created using TradingView
--- Written by Ilya Spivak, Currency Strategist for DailyFX.com
To receive Ilya's analysis directly via email, please SIGN UP HERE
Contact and follow Ilya on Twitter: @IlyaSpivak


