


Talking Points:
- Gold prices rise as UK pre-election poll stokes uncertainty fears
- US news-flow may cool Fed rate hike bets, extending gold gains
- Crude oil prices bounce, looking ahead to key EIA and API data
Gold prices rose, moving inversely of a steep drop in the British Pound. That move was triggered by a poll showing the ruling Conservatives’ lead ahead of the upcoming UK general election shrank to the smallest since mid-July 2016, stoking political uncertainty jitters. Looking ahead, a round of soft US economic data may weigh on Fed rate hike bets and push the yellow metal higher still.
Crude oil prices corrected higher after last week’s post-OPEC meeting plunge. The next batch of significant event risk enters the picture on Wednesday. The EIA releases monthly output figures and API will publish its estimate for weekly inventory flows. OPEC General Secretary Mohammad Barkindo is also set to meet with Russian officials in Moscow. In the meantime, consolidation seems likely.
Retail traders are betting on gold gains. Find out here what that hints about on-coming price moves.
GOLD TECHNICAL ANALYSIS – Gold prices broke through resistance in the 1256.74-63.87 area, completing a bullish Triangle chart pattern (as expected). A daily close above the 38.2% Fibonacci expansion at 1280.35 exposes the April 17 high at 1295.46, followed by the 50% level at 1300.73. Alternatively, a reversal back below 1256.74 targets a chart inflection point at 1256.74.
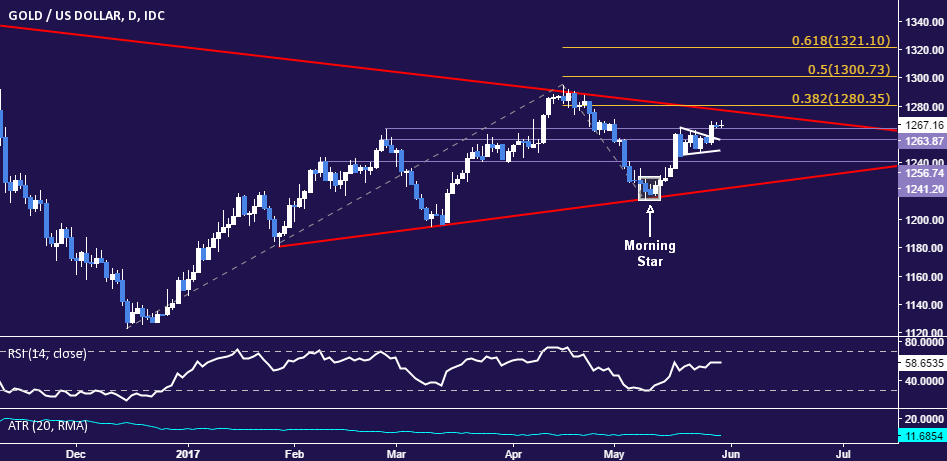
Chart created using TradingView
CRUDE OIL TECHNICAL ANALYSIS – Crude oil prices’ recovery stalled at resistance marked by the 23.6% Fibonacci expansion at 50.09 after finding support above the $48/barrel figure. A daily close above this barrier exposes the 38.2% level at 51.28, followed by a falling trend line at 51.87. Alternatively, a turn below the May 26 low at 48.16 sees the next layer of significant support in the 46.47-47.12 area.
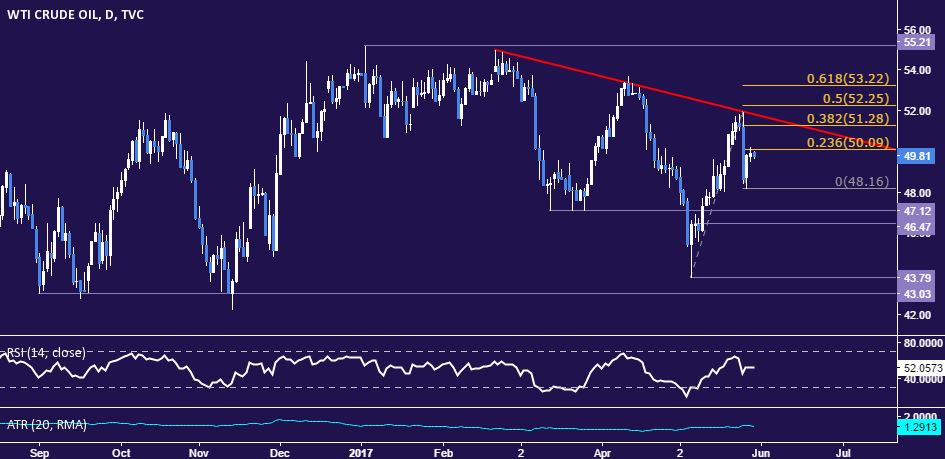
Chart created using TradingView
--- Written by Ilya Spivak, Currency Strategist for DailyFX.com
To receive Ilya's analysis directly via email, please SIGN UP HERE
Contact and follow Ilya on Twitter: @IlyaSpivak


