


Talking Points:
- Crude oil prices may extend drop if weekly inventory build tops forecasts
- API reported 4.53mb increase vs. 1.77mb projected for official EIA data
- Gold price rally may stall to consolidate Before Janet Yellen commentary
Sentiment-sensitive crude oil prices fell alongside stocks as risk appetite soured across the markets. Financial names led Wall Street issues lower, falling nearly 3 percent. Disappointment with a Fed that opted against signaling a steeper rate hike cycle last week may have sparked the move. Speedier tightening would likely translate into improved interest income prospects for lenders.
US Treasury bond yields echoed the drop in equities and the priced-in 2017 monetary policy outlook implied in Fed Funds futures flattened in tandem. Not surprisingly, this bolstered the relative appeal of non-interest-bearing assets and sent gold prices upward. The metal has now erased nearly all of its March losses. Timid comments from Fed officials proved to be an insufficient offset.
A lull in big-splash event risk might make for a period of consolidation for gold prices in the day ahead as investors look ahead to comments from Fed Chair Yellen on Thursday. As for oil, the weekly EIA inventory report is expected to show stockpiles grew by 1.77 billion barrels last week. A print closer to the 4.53 million barrel build projected in private-sector figures from API may weigh on prices.
Are retail traders buying gold, and what does that say about the price trend? Find out here !
GOLD TECHNICAL ANALYSIS – A fifth consecutive gain gave gold prices their longest winning streak since mid-January. Near-term resistance is at 1248.58, the 38.2% Fibonacci expansion, with a daily close above that targeting the 50% level at 1265.23. Alternatively, a turn back below the 23.6% Fib at 1227.99 exposes the 14.6% expansion at 1215.29.
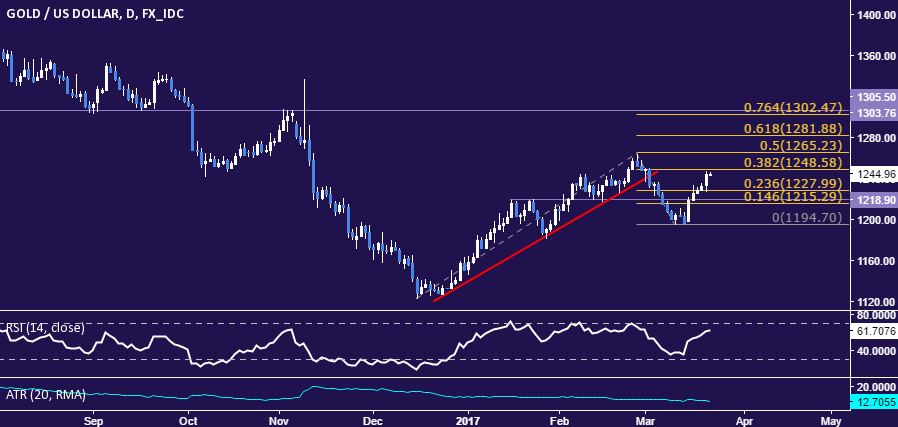
Chart created using TradingView
CRUDE OIL TECHNICAL ANALYSIS – Crude oil prices remain locked in a familiar congestion range above key support at 47.22, the intersection of the 50% Fibonacci retracement and a rising trend line set from August 2016. A break below this barrier exposes the 61.8% level at 45.33. Alternatively, a daily close back above the 38.2% Fib at 49.11 sees the next upside threshold at 51.44, the 23.6% retracement.
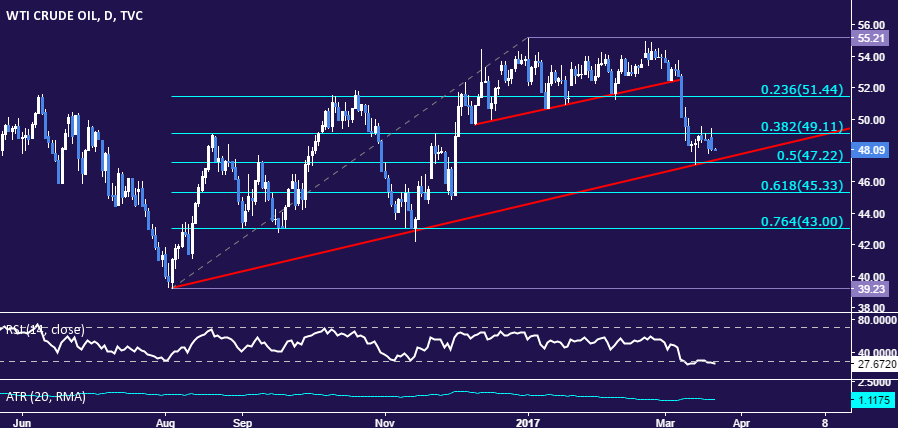
Chart created using TradingView
--- Written by Ilya Spivak, Currency Strategist for DailyFX.com
To receive Ilya's analysis directly via email, please SIGN UP HERE
Contact and follow Ilya on Twitter: @IlyaSpivak


