


Talking Points:
- Gold prices drop as US Dollar, Treasury bond yields rise
- Testimony from Fed Chair Yellen might hurt gold further
- Crude oil prices fall as OPEC, EIA shape output outlook
Gold prices fell as the US Dollar rose alongside Treasury bond yields and the projected 2017 rate hike path implied in Fed Funds futures steepened, undermining the appeal of non-interest-bearing and anti-fiat assets. The move may reflect pre-positioning ahead of much-anticipated Congressional testimony from Fed Chair Janet Yellen. The metal may suffer further if she hints that December’s projection for three increases in the baseline lending rate this year remains intact.
Crude oil prices retreated to the middle of their recent range after OPEC’s monthly report showed that Saudi Arabia overshot its obligations under the cartel’s supply cut accord, slashing production by the most in eight years. Rather than boosting prices, this seemed to tell investors that the supportive influence of output cuts might fade sooner than previously expected even as swing output swells. Indeed, the EIA projected March US shale-oil output to be the highest since May 2016. APIweekly inventory flow data is on tap ahead.
Want to discuss the outlook for crude oil and gold prices with a DailyFX analyst? Join a webinar !
GOLD TECHNICAL ANALYSIS – Gold prices dropped to weekly low as sellers attempt to build momentum following the appearance of a Bearish Engulfing candlestick pattern. Near-term support remains at 1219.20, the 38.2% Fibonacci retracement, with a daily close below that exposing the 23.6% level at 1182.36. Alternatively, a push above the 50% Fib at 1248.98 targets the 61.8% retracementat 1278.76.
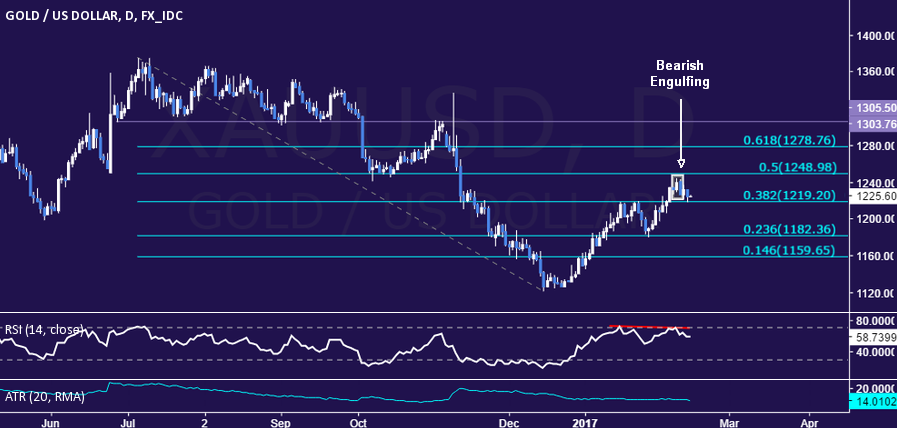
Chart created using TradingView
CRUDE OIL TECHNICAL ANALYSIS – Crude oil prices recoiled from seven-week range resistance at 53.86 once again. From here, a daily close below rising trend line support – now at – exposes the 38.2% Fibonacci retracement at 50.25. Alternatively, a breach above the range top targets the 55.21-65 area (January 3 high, 38.2% Fib expansion).
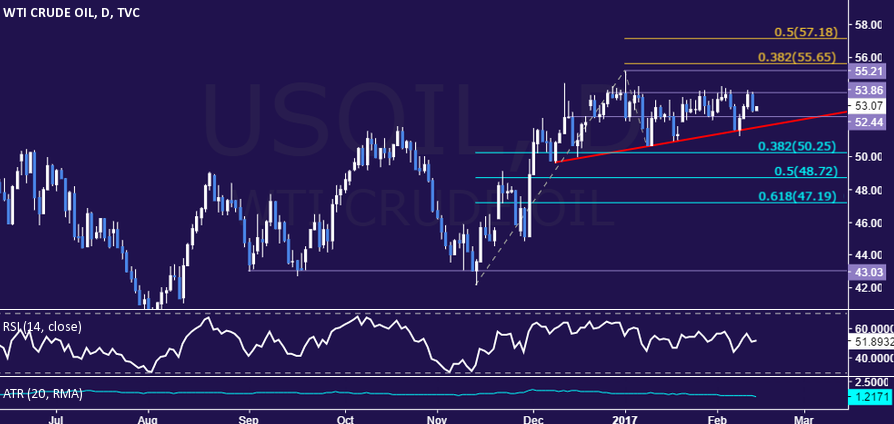
Chart created using TradingView
--- Written by Ilya Spivak, Currency Strategist for DailyFX.com
To receive Ilya's analysis directly via email, please SIGN UP HERE
Contact and follow Ilya on Twitter: @IlyaSpivak


