


Talking Points:
- Crude oil prices extend gains as “Trump trade” unwind continues
- Gold prices may turn lower as US data revives Fed rate hike bets
- Rig count data may cloud WTI responsiveness to US Dollar moves
US Dollar selling in the wake of yesterday’s press conference with President-elect Donald Trump continued to propel crude oil prices higher. The WTI benchmark is priced in terms of the greenback and so enjoys a de-facto boost when the currency weakens.
Not surprisingly, gold prices likewise advanced as ebbing Fed rate hike speculation increased the relative appeal of non-interest-bearing and anti-fiat assets.
The weekly US Dollar forecast argued for a cooling of the “Trump trade” through most of this week and the markets have delivered accordingly. Top-tier US economic data may now emerge as a lifeline. Retail sales, consumer confidence and PPI figures are all due to cross the wires before the week-end.
Economists’ expectationsare pointing to improvements on all fronts and US economic news-flow has increasingly outperformed relative to consensus forecasts recently, bolstering the case for upbeat results. Gold may retreat if a broadly strong showing echoes last week’s jobs report, rekindling Fed tightening bets.
The implications for crude oil may be more convoluted. The Dollar/WTI relationship works both ways, so a resurgent US currency may put prices under pressure. The weekly Baker Hughes rig count report might muddy the waters however as markets weigh the impact of swing producers against OPEC supply-cut efforts.
Where are gold and crude oil prices going in the first quarter? See our forecasts here !
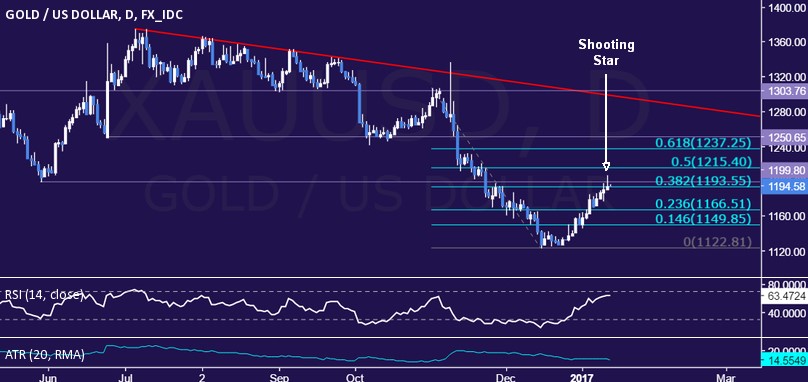
GOLD TECHNICAL ANALYSIS – Gold prices put in a Shooting Star candlestick below resistance in the 1193.55-99.80 area (38.2% Fibonacci retracement, May 30 low), hinting a turn lower may be ahead. Near-term support is at 1166.51, the 23.6%level, with a break below that exposing the 14.6% Fib at 1149.85. Alternatively, a daily close above resistance targets the 50% retracement at 1215.40.
CRUDE OIL TECHNICAL ANALYSIS – Crude oil prices continue to edge higher after putting in a Bullish Engulfing candlestick pattern, though prices have yet to conclusively overturn the series of lower highs and lows set form the January 3 peak. Resistance is now at 53.75, the 23.6% Fibonacci expansion, with a daily close above that exposing the 55.21-65 area (swing high, 38.2% level). Alternatively, a move back below the 14.6% Fib at 52.59 targets the 50.25-69 zone (38.2% Fib retracement, January 10 low).

--- Written by Ilya Spivak, Currency Strategist for DailyFX.com
To receive Ilya's analysis directly via email, please SIGN UP HERE
Contact and follow Ilya on Twitter: @IlyaSpivak


