


Talking Points:
- Gold prices drop most in 15 months on swelling Fed rate hike bets
- Crude oil prices close higher for fifth day on API inventory data
- US ISM, ADP and EIA reports set to drive near-term price action
Gold prices plunged, posting the largest decline in 15 months, as firming Fed rate hike speculation undermined demand for anti-fiat and non-interest-bearing assets. Tellingly, the metal sank and front-end US yields advanced as shares of Deutsche Bank put in an intraday floor and traded higher. The advance began in Frankfurt trade and continued as US-listed issues took over, ultimately settling with the strongest close in two weeks by the end of the Wall Street trading session. Traders may have perceived receding fears of Deutsche-driven market instability as bolstering the likelihood of a rate hike by year-end. Indeed, the priced-in probability of an increase in December grew to 61.2 percent, the highest in two weeks.
Crude oil prices fell with risk appetite trends. The WTI benchmark started the day on a chipper note, rising alongside European buoyed by Deutsche Bank’s recovery. Optimism faltered after reports suggesting that ECB policymakers are close to an informal consensus on tapering QE purchases as the optimal approach for winding down stimulus. Markets appeared to infer that the mere planning of an exit strategy implies that tightening is on the horizon. Crude retreated alongside stocks but supportive API inventories data offered another upward jolt. The industry group reported that stockpiles fell by 7.6 million barrels last week.
Looking ahead, US economic data is in the spotlight. The ISM Non-manufacturing Composite gauge and the ADP Employment report headline the docket, with the former expected to show service-sector activity growth accelerated in September (53.0 vs. 51.4 prior) while the latter points to a slight slowdown in job creation over the same period (165k vs. 177k prior).
US data flow has been stabilizing relative to consensus forecasts in recent weeks. If this proves to foreshadow outcomes close to what economists’ models are projecting, the results are unlikely to upset trends that the FOMC was apparently citing as it argued following last month’s meeting that the case for a rate hike has strengthened. That may encourage priced-in tightening probability to strengthen further, pushing the US Dollar higher and punishing gold. The stronger greenback may also weigh against the USD-denominated WTI contract but prices may find a lifeline if EIA inventory numbers mirror API estimates. As it stands, median projections call for a build of 1.06 million barrels.
Track short-term crude oil and gold price patterns with the GSI indicator !
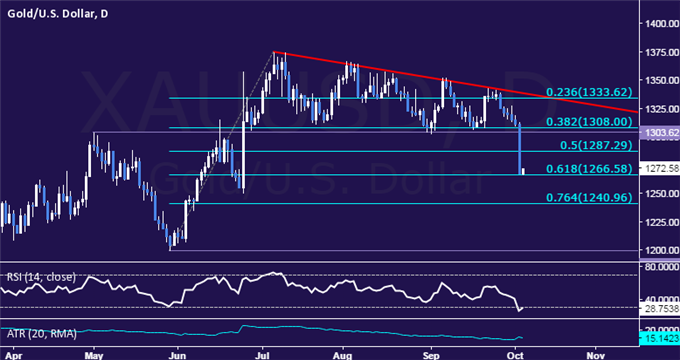
GOLD TECHNICAL ANALYSIS – Gold prices broke support capping losses since late July, pushing deeply below the $1300/oz figure. From here, a daily close below the 61.8% Fibonacci retracement at 1266.58 exposes the 76.4% level at 1240.96. Alternatively, a reversal back above the 50% Fib at 1287.29 opens the door for a retest of the 1303.62-1308.00 area (May 2 high, 38.2% retracement).
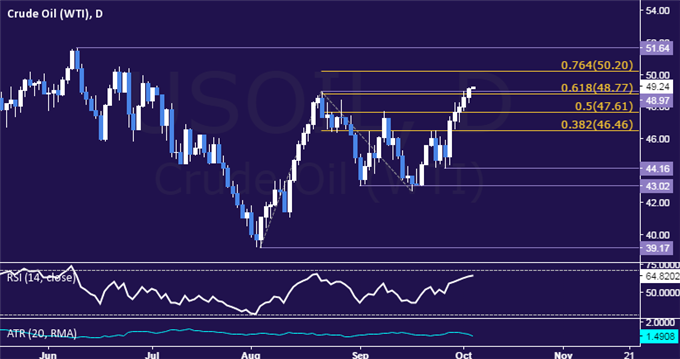
CRUDE OIL TECHNICAL ANALYSIS – Crude oil prices rose for the fifth consecutive day, marking the longest winning streak in seven weeks. A break above Augusts’ swing high has now exposed the 76.4% Fibonacci expansion at 50.20, with a close above that paving the way for a challenge of June’s high at 51.64. Alternatively, a reversal back below the 61.8% level at 48.77 targets the 50% Fib at 47.61.
--- Written by Ilya Spivak, Currency Strategist for DailyFX.com
To receive Ilya's analysis directly via email, please SIGN UP HERE
Contact and follow Ilya on Twitter: @IlyaSpivak


