


Talking Points:
- Crude oil prices snap losing streak as Russia backs output freeze
- WTI may continue to rise as OPEC courts Iran for supply accord
- Gold prices may pause to digest having gained on US jobs data
Crude oil prices snapped afive-day losing streak after Russian President Vladimir Putin said he supports an output freeze deal coordinated with OPEC producers. The comments mark yet another about-face in Russia’s position on a supply restriction after Energy Minister Alexander Novak said such a deal was not necessary just a day before the President spoke. Putin argued that any output accord should include flexibility for Iran as it works to rebuild capacity to pre-sanctions levels.
Looking ahead, output restriction hopes may continue to be supportive in the near term following news that Russia and Saudi Arabia agreed to work together to ensure oil market stability on the sidelines for the G20 summit in China over the weekend. Meanwhile, Iran‘s Mehr news agency reported that Oil Minister Bijan Namdar Zanganeh will meet OPEC Secretary-General Mohammed Barkindo this week to discuss implementation of a potential supply-side agreement, suggesting Mr Putin’s proposed framework may be gaining traction.
Gold prices traded higher in the wake of Friday’s US jobs report. The data revealed that the economy added 151k jobs in August compared with 180k expected by economists. The outcome initially sank US yields and the US Dollar while boosting gold as traders took the miss as a negative for Fed rate hike prospects. Benchmark borrowing costs and greenback would swiftly recover however, perhaps because the payrolls print nudged the three-month trend average above the 190k level cited by Fed Chair Yellen as supportive of tightening. Gold diverged however, holding on to most of the day’s advance. A consolidative tone is likely from here as a lull in US event risk against a backdrop of the Labor Day holiday marks a slowdown in Fed policy speculation.
What do past crude oil and gold trading patterns hint about on-coming trends? Find out here !
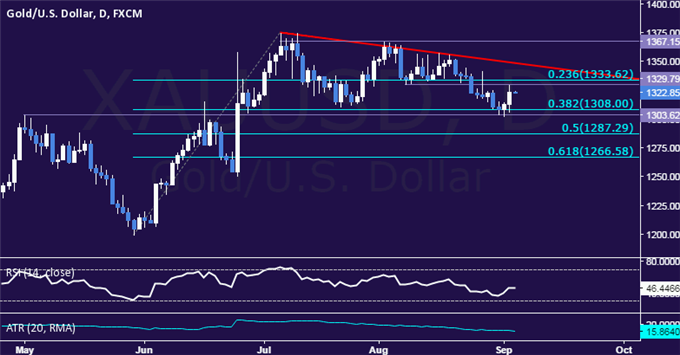
GOLD TECHNICAL ANALYSIS – Gold prices are attempting to mount a rebound from familiar support in the 1303.62-08.00 area (May 2 high, 38.2% Fibonacci retracement). A break above the 1329.79-33.62 zone (August 8 low, 23.6% level) targets a falling trend line set from early-July, now at 1348.45. Alternatively, a breach of support exposes the 50% Fib at 1287.29.
CRUDE OIL TECHNICAL ANALYSIS – Crude oil prices put in a bullish Piercing Line candlestick pattern, hinting a rebound may be in the cards ahead. A daily close above the 14.6% Fibonacci expansion at 44.45 exposes the 23.6% level at 45.33. Alternatively, a drop below the September 1 low at 43.02 targets the August 11 bottom at 41.08.

--- Written by Ilya Spivak, Currency Strategist for DailyFX.com
To receive Ilya's analysis directly via email, please SIGN UP HERE
Contact and follow Ilya on Twitter: @IlyaSpivak


