


Nasdaq 100, Risk Trends, Australian Jobs, New Zealand GDP – Talking Points
- US stocks rise as traders shift back into risk assets, tech leads
- Australian jobs data presents high potential risk event in APAC
- New Zealand GDP impresses, RBNZ rate hike bets swing higher
- Nasdaq 100 gains after finding support at key moving averages

Thursday’s Asia-Pacific Forecast
Asia Pacific markets look set to open higher following upbeat trading in New York on Wednesday and a blowout New Zealand GDP report. US stocks closed higher across the major equity indexes, with the tech-heavy Nasdaq 100 and small-cap focused Russell 2000 indexes leading the gains. The safe-haven US Dollar fell versus a basket of major peers, while the risk sensitive Australian Dollar and New Zealand Dollar caught bids.
Treasury yields gained overnight amid the renewal of risk taking, with the benchmark 10-year yield rising nearly 2%. That move retraced a large portion of the move seen earlier this week after the US CPI print disappointed expectations. Gold prices fell over 0.5% as traders ditched the government bonds, suggesting that the market's initial reaction to the CPI print pushing back tapering may have been overblown. The rollback in yields was also a tailwind for growth-sensitive technology stocks.

Traders are eagerly awaiting Australia’s August job numbers, due out this morning. Analysts expect an employment change of -80.0k jobs, according to a Bloomberg survey. That would be the worst job loss for the economy since May 2020, when Australia lost 264.8k jobs. The downbeat figures stems from lockdowns across New South Wales (NSW) and Victoria, which have been in place for months as Covid sweeps across the states.
The Australian Dollar is down over 5% since June versus the US Dollar. Given Australia’s well-choreographed policy responses to Covid, the Aussie Dollar likely already has a good portion of the current economic slowdown already priced in. That said, AUD/USD may move higher if the job numbers surprise to the upside. Alternatively, a weaker-than-expected print will likely reinforce the RBA’s dovish policy outlook, which may weigh further on the Australian Dollar.
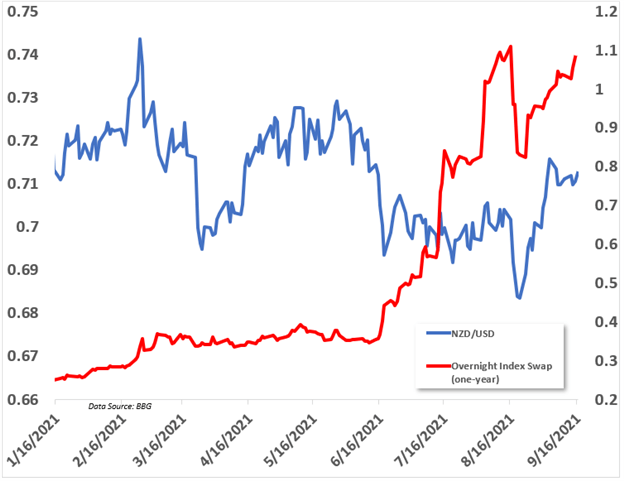
Elsewhere, New Zealand reported its second-quarter gross domestic product growth figures. Q2 GDP year-over-year growth crossed the wires at 17.4%, surpassing the 16.1% Bloomberg surveyed consensus forecast. That was the best growth on record. The New Zealand Dollar accelerated higher following the data prints. The one-year overnight index swap has been on the move higher lately, nearly eclipsing its August high. This indicates bullish rate hike bets are increasing for the RBNZ.
Nasdaq Technical Forecast
The Nasdaq 100 Index (NDX) ended a five-day losing streak on Wednesday, gaining 0.78% at close. A bearish Engulfing Candlestick formed early in the multi-day selloff on the four-hour chart. Prices fell to the rising 20-day Simple Moving Average (SMA), which provided support. The upward price action appears to have averted a MACD cross below the center line, a bearish sign. RSI is also tracking higher within neutral territory.
NDX 4-Hour Chart
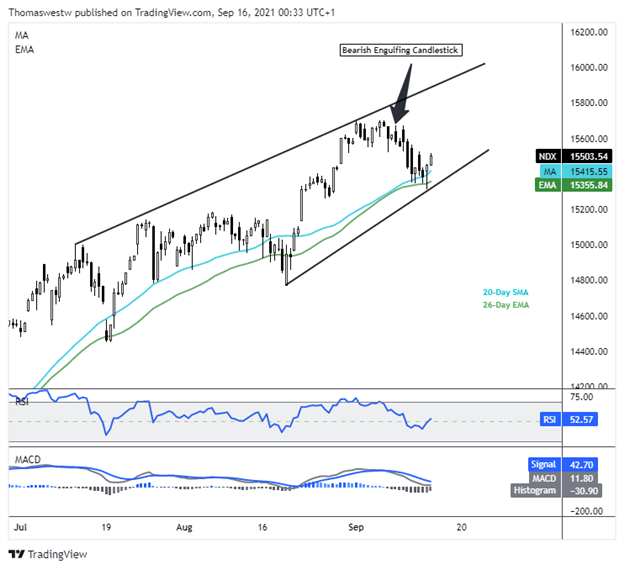
Chart created with TradingView
--- Written by Thomas Westwater, Analyst for DailyFX.com
To contact Thomas, use the comments section below or @FxWestwater on Twitter


