Asia Pacific Market Open Talking Points
- Risk aversion receded as the Japanese Yen depreciated
- Asia stocks may follow Wall Street higher as AUD gains
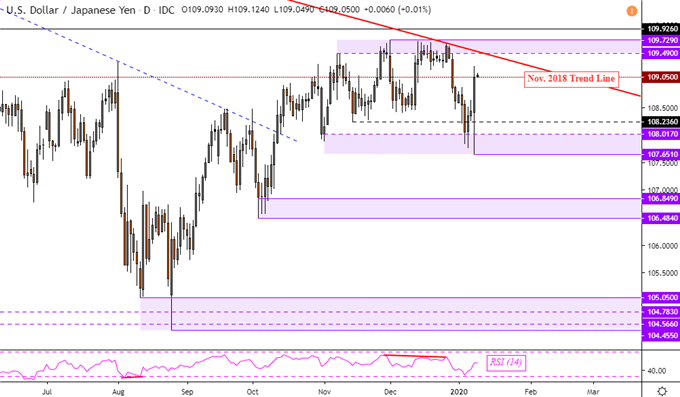
- Did USD/JPY just experience a false downside breakout?
Japanese Yen Sinks as Risk Aversion Recedes
After kneejerk volatility overnight, sentiment improved by the conclusion of the Wall Street trading session. Fears of US-Iran geopolitical escalation subsided as President Donald Trump delivered remarks on Iran at the White House. He said that the country “appears to be standing down” after an attack that sent crude oil prices rallying as much as 4 percent temporarily earlier in the session.
The anti-risk Japanese Yen was thus the worst-performing major currency on Wednesday as it reversed deep losses. On Wall Street, the S&P 500 and Dow Jones closed 0.49% and 0.56% to the upside respectively. WTI crude oil fell 4.34% in its worst performance over the course of one day since the end of November 2019. If you calculate it from its intraday high, the commodity fell over 8.5%.


Focusing back on foreign exchange markets, the pro-risk Australian Dollar and New Zealand Dollars aimed cautiously higher. This is as the US Dollar appreciated as local government bond yields rallied. Anti-fiat gold prices understandably pulled back. Markets are still vulnerable to sudden escalation that risks sparking volatility in the near-term however. Follow our team feed for the latest updates.
Thursday’s Asia Pacific Trading Session
S&P 500 futures are pointing little to the upside and Asia Pacific equities may follow Wall Street’s rosy lead. That may pave the way for further weakness in the Japanese Yen as it loses ground to sentiment-linked currencies such as the AUD and NZD. The Australian Dollar will be watching the next round of Chinese inflation data as a favored liquid-proxy of the world’s second-largest economy.
Japanese Yen Technical Analysis
The climb in USD/JPY over the past 24 hours overturned downside breakout prospects after prices temporarily traded around lows last seen since late October. That has left behind a new psychological barrier which is a range between 107.65 to 108.01. The long-term downside bias still holds via falling resistance from the end of 2018. Recent signals from trader positioning seem to favor near-term gains.
| Change in | Longs | Shorts | OI |
| Daily | -2% | 2% | 0% |
| Weekly | 12% | -16% | -6% |
USD/JPY Daily Chart

Chart Created Using TradingView
--- Written by Daniel Dubrovsky, Currency Analyst for DailyFX.com
To contact Daniel, use the comments section below or @ddubrovskyFX on Twitter


