


US STOCKS OUTLOOK:
- The S&P 500 ekes out small gain, while the Nasdaq 100 falls for the second day in a row
- Microsoft and Alphabet’s earnings to steal the spotlight on Tuesday
- The FOMC monetary policy decision will take the center stage on Wednesday
Trade Smarter - Sign up for the DailyFX Newsletter
Receive timely and compelling market commentary from the DailyFX team
Most Read: Crude Oil Price Forecast - Make or Break Time as Triangle Apex Nears. What’s Next?
U.S. stocks were mixed on Monday amid cautious sentiment in a session devoid of major drivers or extreme volatility ahead of key corporate earnings from big tech names and high-impact economic events, such as the July FOMC monetary policy decision (Wednesday) and the U.S. second-quarter gross domestic product report (Thursday).
At the closing bell, the S&P 500 advanced 0.13% to 3,966, with the energy sector outperforming across the board on the back of a solid rally in oil and natural gas prices. The Nasdaq 100, for its part, declined 0.55% to 12,328, losing ground for the second day in a row, dragged down by rising U.S. Treasury yields and a sharp decline in Nvidia, Meta Platforms and Adobe share prices.
Looking ahead, there are several catalysts to keep an eye on that that could spark volatility in the equity space this week. On Tuesday, traders should parse financial results from two heavy hitters: Microsoft and Alphabet, Google’s parent company. Both companies, with a combined market capitalization in excess of $3 trillion, are heavily weighted in the S&P 500 and Nasdaq 100, meaning that their stock performance could set the tone on Wall Street.

For Microsoft (MSFT), analysts forecast EPS of $2.28 on sales of $52.87 billion. Meanwhile, Alphabet (GOOGL) is seen reporting earnings per share of $1.28 on revenue of $70.78 billion. While quarterly execution will certainly matter, it is pivotal to pay closer attention to profit guidance to see if these large technology firms are preparing for a significant downturn, considering that they have eased up on hiring.
On Wednesday, all eyes will be on the FOMC interest rate decision. The Fed is expected to raise interest rates by 75 bp to 2.25%-2.50% as it presses ahead with aggressive monetary tightening to curb inflation. This move is fully priced in, so traders should focus on Chair Powell’s comments during his press conference.
With U.S. consumer prices expected to cool in the coming months following the recent sell-off in commodity prices and growing recession risks, Powell is unlikely to drop any new hawkish bombshells.This scenario may be somewhat favorable for equities, although earnings and economic activity developments may prove more important for risk assets in the short term.

NASDAQ 100 TECHNICAL ANALYSIS
The Nasdaq 100 rallied strongly early last week, but the upside momentum faded after prices failed to break above resistance near 12,600. From those levels, the index has begun to pullback, falling for two straight sessions on Monday. If selling interest accelerates in the coming days, initial support rests at 12,250. On further weakness, the tech benchmark could slide towards the psychological 12,000 mark, challenging its 50-day simple moving average.
On the flip side, if buyers regain control of the market and trigger a bullish reversal, the first resistance to consider appears around the 12,600 area. If this ceiling is breached, we could see a move towards the 13,000 zone.
NASDAQ 100 TECHNICAL CHART
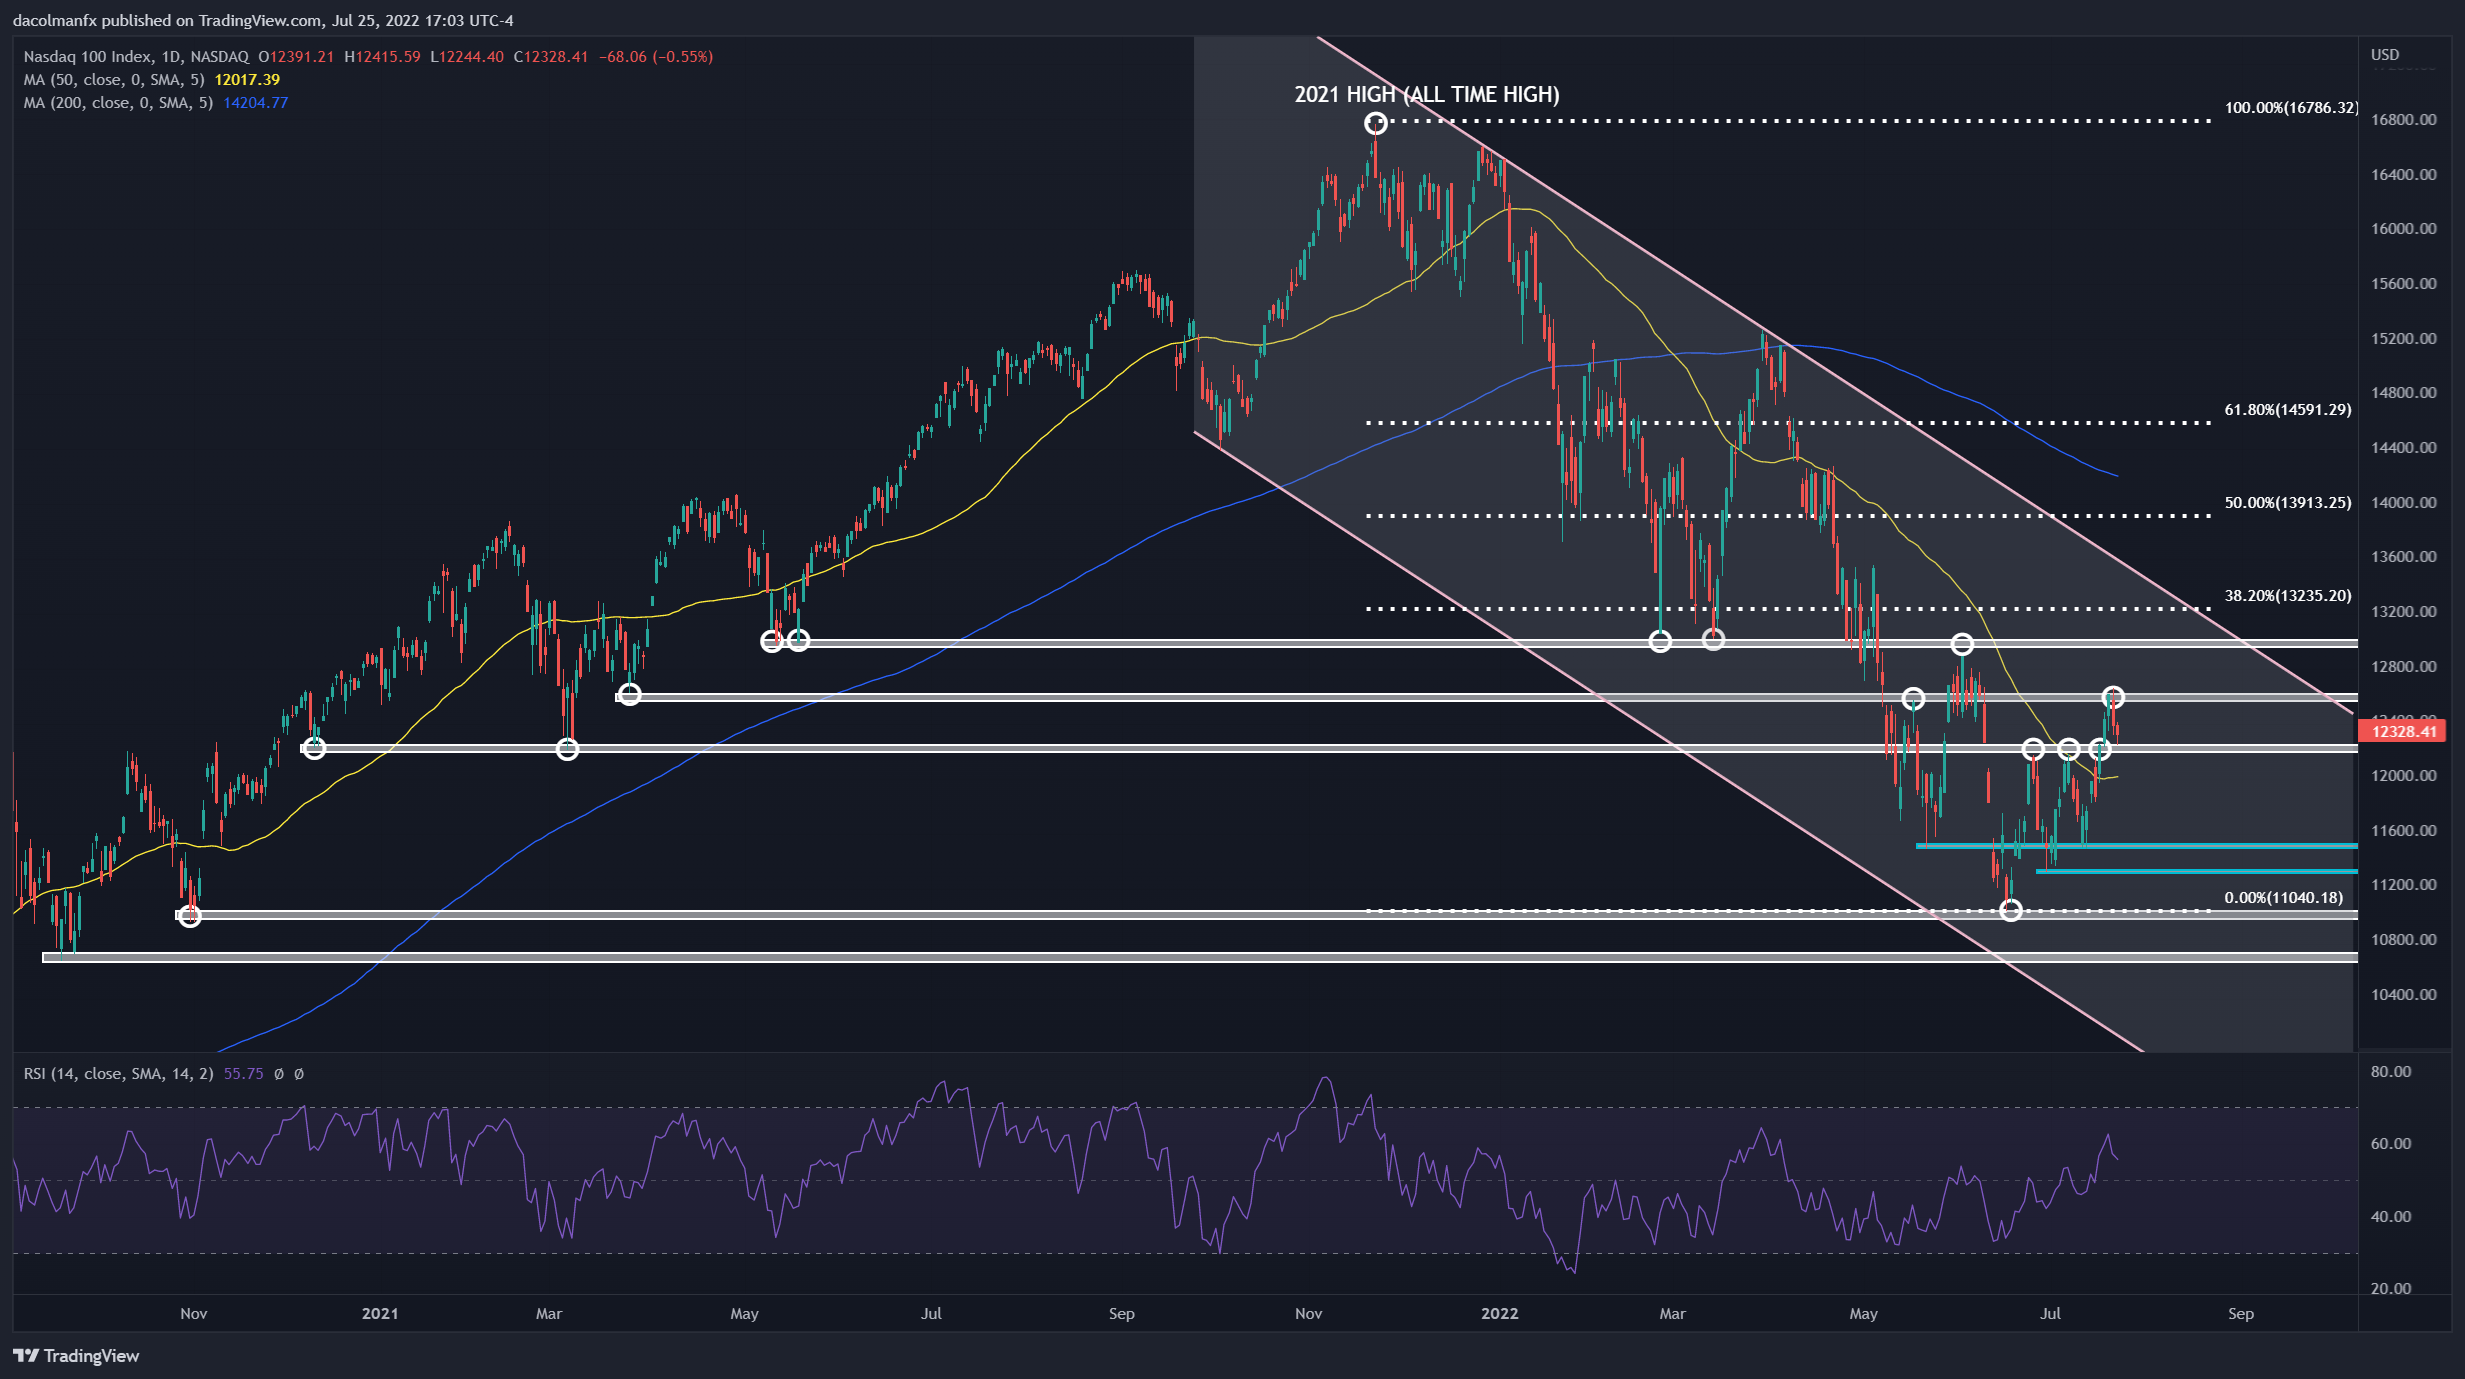
Nasdaq 100Daily Chart Prepared Using TradingView
EDUCATION TOOLS FOR TRADERS
- Are you just getting started? Download the beginners’ guide for FX traders
- Would you like to know more about your trading personality? Take the DailyFX quiz and find out
- IG's client positioning data provides valuable information on market sentiment. Get your free guide on how to use this powerful trading indicator here.
---Written by Diego Colman, Market Strategist for DailyFX


