


What is COP26 and Why Does it Matter for Markets?
Against the backdrop of rising energy prices leading to economic fallout for economies in Asia, Europe, and North America, COP26, a two-week event, is set to begin on October 31 in Glasgow, Scotland. The United Nations’ Conference of Parties (COP) was first held in 1995, and COP26 gets its name for this year’s meeting being the 26th iteration of such an event.
History of global temperature change and causes of recent warming (Chart 1)

Source: Climate Change 2021: The Physical Science Basis - Summary for Policymakers (IPCC)
COP26, later this month and in early-November, will be an attempt to get countries on the path to fulfilling the goals laid out in the 2015 Paris Climate Agreement. The Paris accord outlined the goal of keeping the planet from warming by 2 degrees Celsius by the year 2100, and if possible, to stop warming at 1.5 degrees Celsius (relative to pre-industrial era readings).
Per a report released this summer from the UN’s Intergovernmental Panel on Climate Change (IPCC), the planet has roughly ten years left to make significant cuts to emissions before the 1.5-degree Celsius threshold is reached, with the planet already having warmed by 1-1.2 degrees Celsius relative to the end of the 19th century.
Assessed contributions to observed warming in 2010–2019 relative to 1850–1900 (Chart 2)

Source: Climate Change 2021: The Physical Science Basis - Summary for Policymakers (IPCC)
A sense of urgency underscores COP26, but the October/November summit – whose aim is effectively to curb use of fossil fuels like coal and oil – is arriving at the worst possible time thanks to a budding energy supply crisis gripping most of the globe’s major economies.
Why Are Energy Supply Concerns Proliferating?
To meet their obligations laid out in the Paris Climate Agreement, many of the world’s major economies – China, the UK, the US, among others – have attempted to scale back their use of coal and oil as primary energy sources. But with the coronavirus pandemic’s impact still being felt, supply chains have been in disarray. Just days ahead of COP26, China announced that they would begin to restart coal production in order to meet the country’s energy needs.
Companies unable to secure raw materials in a timely manner as well as labor markets not recovering as quickly as anticipated have created job shortages in key areas like truck drivers, leaving energy supplies unable to be transported (Europe, the UK). Closures at ports have compounded the problem (the US). Trade tensions remain tense in some areas (Australia, China). Seasonally, with winter coming in the Northern Hemisphere, fears are that demand will continue to outstrip available energy supplies (fossil fuels or renewables) that could create a more significant economic issue over the coming months.
How Could COP26 Exacerbate Energy Supply Issues?
It is no secret that the world’s major economies are doing a poor job at achieving the goals laid out in the 2015 Paris Climate Agreement. Recent attempts to do so – by cutting coal consumption, for example – have created a scarcity of available electricity, which has disrupted global manufacturing chains based out of Asia (China), contributing to the rise in inflation felt in North America and Europe.
The goals outlined at COP26 over the coming weeks may be noble, but without available alternative energy sources – an abundance of renewables such as hydro, solar, and wind, as well as the typically controversial nuclear option – efforts to slow down and even reverse the planet’s warming may very-well provoke deeper problems for the world’s major economies in 4Q’21 and into 2022.
What Assets Could Be Impacted by COP26 Efforts?
From a trader’s perspective, the goals outlined at COP26 could prove to have a long-term impact on various markets, especially commodities and currencies. A reduction in oil production, for example, without available alternative energy sources, could provoke significantly higher energy prices in the short-term as demand remains robust.
Currencies whose economies are significant exporters of fossil fuels like the Australian Dollar, Canadian Dollar, and Norwegian Krone, could see increased speculation around potential for gains before the longer-term narrative of transitioning away from fossil fuels weighs on price action. Opportunity may continue to grow for those market participants that appear to be providing a solution to the problem, such as electrical vehicle companies like Tesla.

Long-term Technical Outlook for COP26-sensitive Assets
Oil and energy sit at the crossroads of geopolitics, largely because there are choices that can be made that can improve or diminish the supply/demand equilibrium of many of these markets. And while the various decisions around those choices may seem clear to you or I, messiness is a feature of democracy, not a bug, and this can often lead to an imbalance in policy from administration to administration. Messiness can set off a whole host of changes in the geopolitical picture.
This is very evident in oil production, which still succumbs to the supply constraints of major producers such as OPEC-plus, Russia, Canada and more recently, the United States.
As oil prices ran high in 2007 and 2008, the drive for US energy independence was high, and this led to significant investment in shale extraction which was previously thought of as impossible and/or far too costly. Shale extraction added significant supply to US oil potential but it also came with uncertain environmental consequences.
The concern around those environmental consequences has had profound impact, with support driven towards companies like Tesla that are working on a future with less reliance on fossil fuels.
Crude Oil
But in crude oil, the move that showed this year has the power to continue and with oil prices hitting a fresh seven-year-high, and while overbought on a shorter-term basis, there is little standing in the way of a run up to the 90-handle. The 100 level is a major psychological level and this is the point where the politics of oil might find its way back into the headlines as a major inflection point: Whether or not that’ll induce price action remains another matter entirely.
Crude Oil Monthly Price Chart (Chart 3)
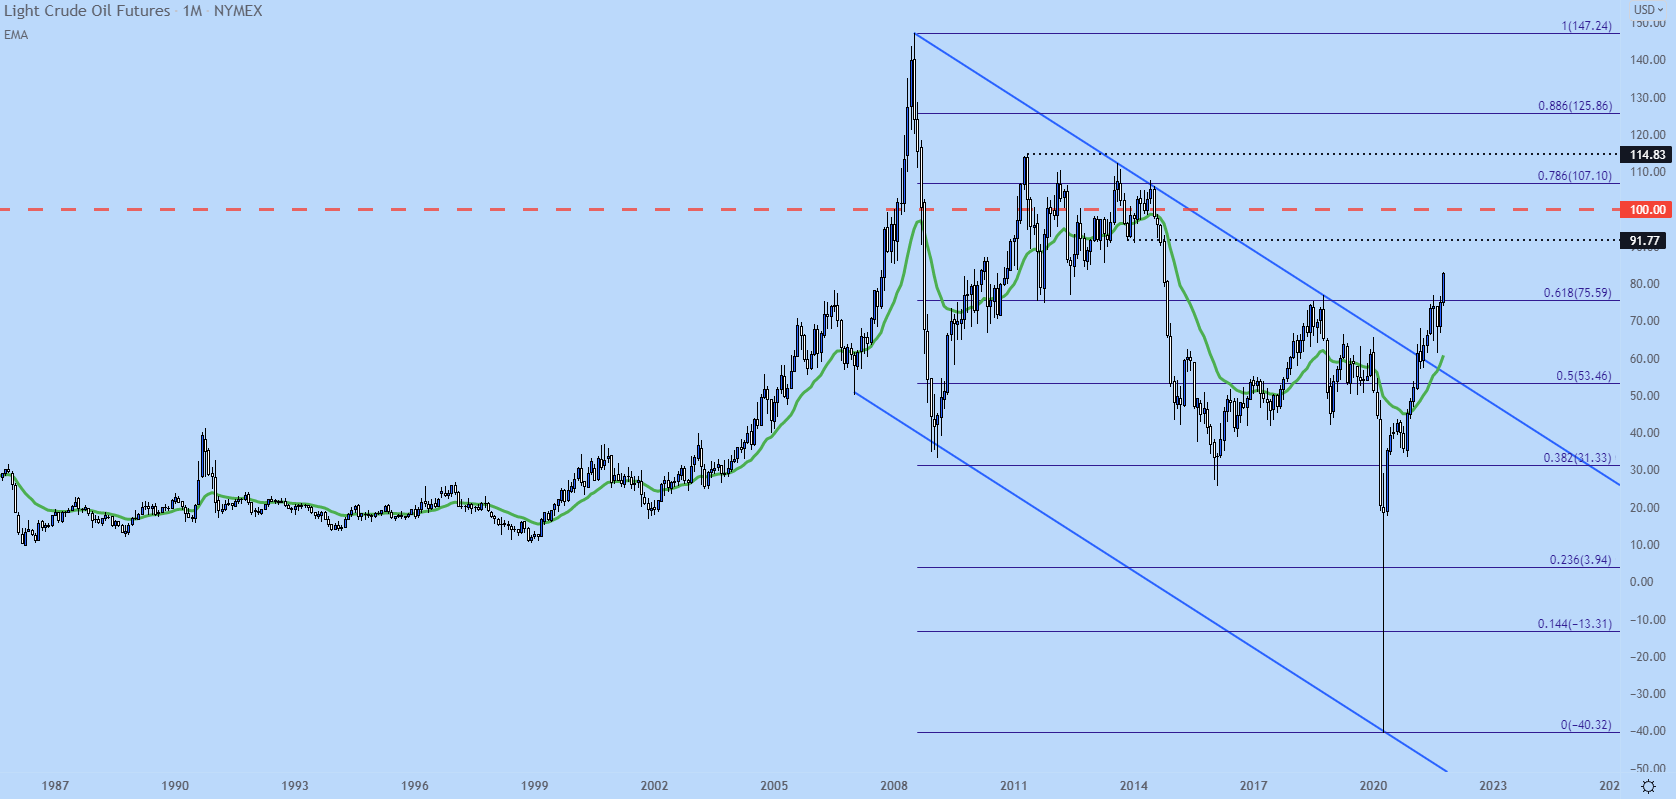
Chart prepared by James Stanley; Crude Oil on Tradingview

Natural Gas
Natural gas faces some of the same problems as oil: extraction is dirty and brings unknown environmental consequences, adding significant red tape for new projects and this, of course, constrains supplies. It is necessary, however, for residential and commercial heating and the world relies heavily on this resource during the frigid winter months.
In Europe, there’s particular concern for this winter. Much of the continent’s natural gas supply comes from Russia or Norway, which makes them vulnerable to price changes and, of course, supply disruptions. The consequences of an adverse scenario are high, illustrated by the warning last month that UK supermarkets may face shortages of fresh food after a US fertilizer manufacturer suspended production due to rising gas prices. This cut off as much as 60% of Britain’s supply of carbon dioxide, which has a wide range of uses in the food chain.
One look at the Natural Gas chart shows that there could be more room for this trend to run, as prices have simply pushed up for a test of the eight-year high, plotted at 6.493.
October, thus far, has been a pullback; but support has showed up at a key spot, the 23.6% Fibonacci retracement of the 2005-2020 major move, which is confluent with the prior seven-year-high, plotted around the 4.824 area.
Natural Gas Monthly Price Chart (Chart 4)

Chart prepared by James Stanley; Natural Gas on Tradingview
USD/CAD
Given the heavy deposits of natural resources in Canada, the Canadian Dollar will often trade with a similar drive as crude oil, and at times that correlation can be profound with oil and CAD moving in tune with each other.
If we are looking at crude oil making a run at the 90-handle, then there could be significant breakdown potential in USD/CAD, which had shown ahead of the 2021 open, and continued into June until support started to come into play around the 1.2000 handle. Along the way, the US Dollar caught a bid and extended that retracement into a fifth month until sellers came back with aggression.
The next big spot of support is around that same 1.2000 handle, after which a break would amount to fresh six-year-lows in the pair. There could be even greater bearish potential beyond that price, with the area around 1.1500 presenting some interest for longer-term support.
USD/CAD Monthly Price Chart (Chart 5)
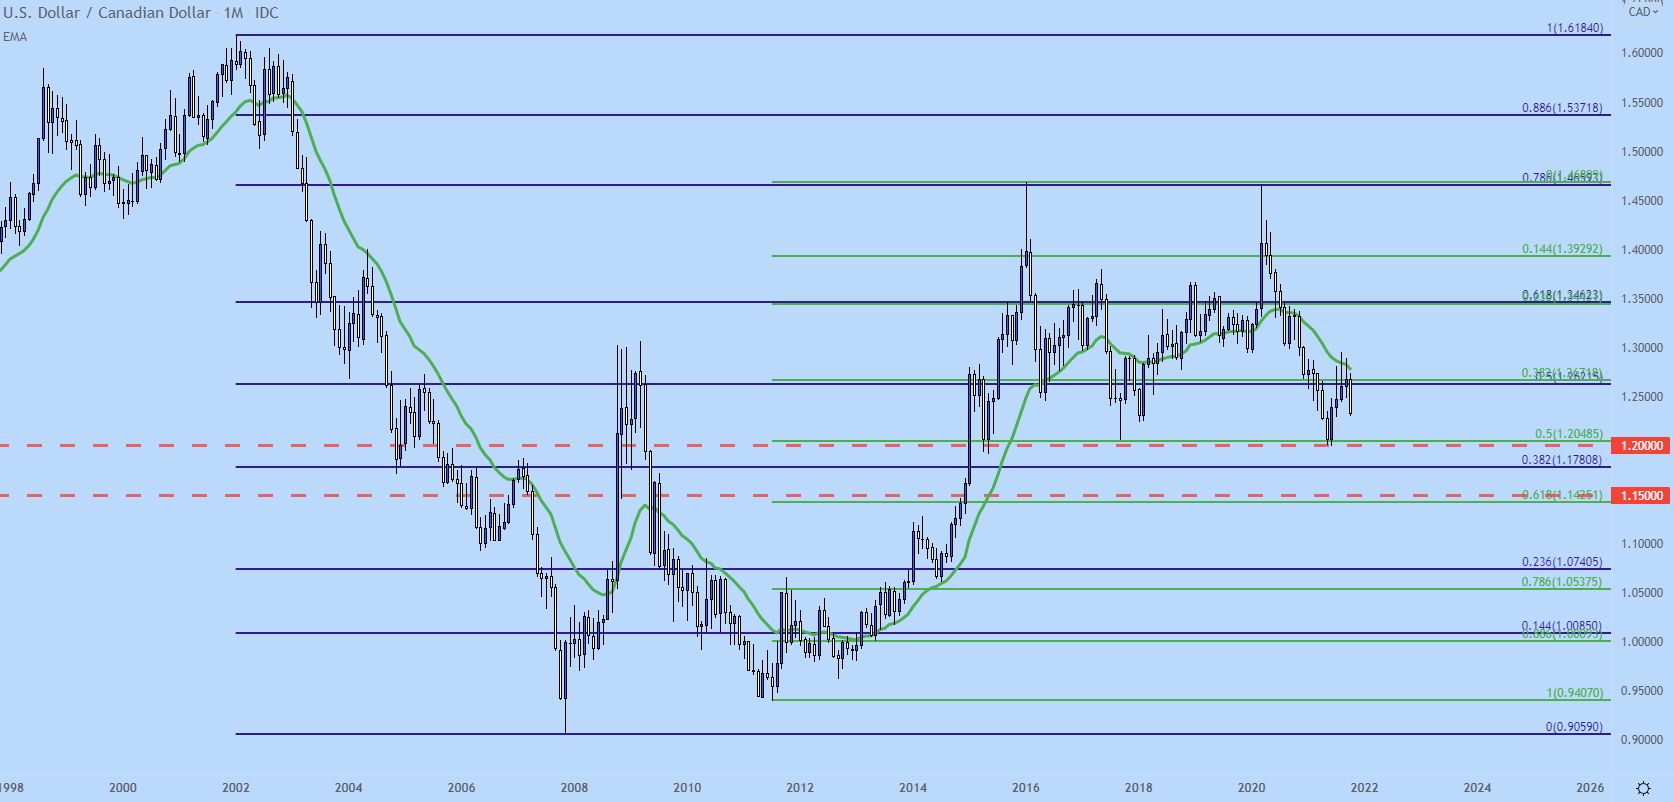
Chart prepared by James Stanley; USDCAD on Tradingview
USD/NOK
USD/NOK carries a similar outlay as USD/CAD, with a currency from an oil-rich nation could see significant strength should energy prices continue to rise. In USD/NOK, the technical outlook has been a bit more prone to recent trends, and at this point a bullish trendline continues to hold the low. This trendline is what came into play to cauterize support from April-June, with a morning star formation basing off that trendline projection. The bullish response that formation capped out at the 9.0000 handle, and price action has reverted for a trendline test.
A breach of that three-year-low established in April, plotted around 8.1500, can open the door for a run down towards the Fibonacci level and prior support swing around 7.6887, and if that cannot hold, there is an air pocket all the way down to the 7.3123 level.
USD/NOK Monthly Price Chart (Chart 6)

Chart prepared by James Stanley; USDNOK on Tradingview
Tesla: The Ultimate Pump
Perhaps no corporation illustrates the world’s tolerance of crude oil like Tesla. The electric car manufacturer has no short of naysayers owed to exorbitant valuations and, let us call them unusual business practices. At this point, Tesla’s market cap is more than that of the nine largest auto manufacturers in the world – all nine. And Tesla currently makes up less than 1% of all auto sales so this is a glaring divergence that is caused many great fund managers to open short on Tesla only to get burned because the price just continually moved higher.
At the core of this push is the green movement, with government subsidies continuing to support Tesla’s business model by incentivizing consumers to buy their product. In many ways, Tesla has profoundly changed the industry, but competition was not ready to wait around and watch their share go up in fumes. Instead, we have seen these established auto manufacturers incorporate more of a green model, and in many cases these manufacturers already have established sales and distribution systems.
Tesla was a very volatile stock before Covid, but it became an entirely new animal after the pandemic, with TSLA jumping by more than 1,100% from the March 2020 low up to the January 2021 high. Rightfully, after such a run, the stock then put in a pullback, retracing until support began to form around the 38.2% retracement of that major move.
Tesla Daily Price Chart (Chart 7)
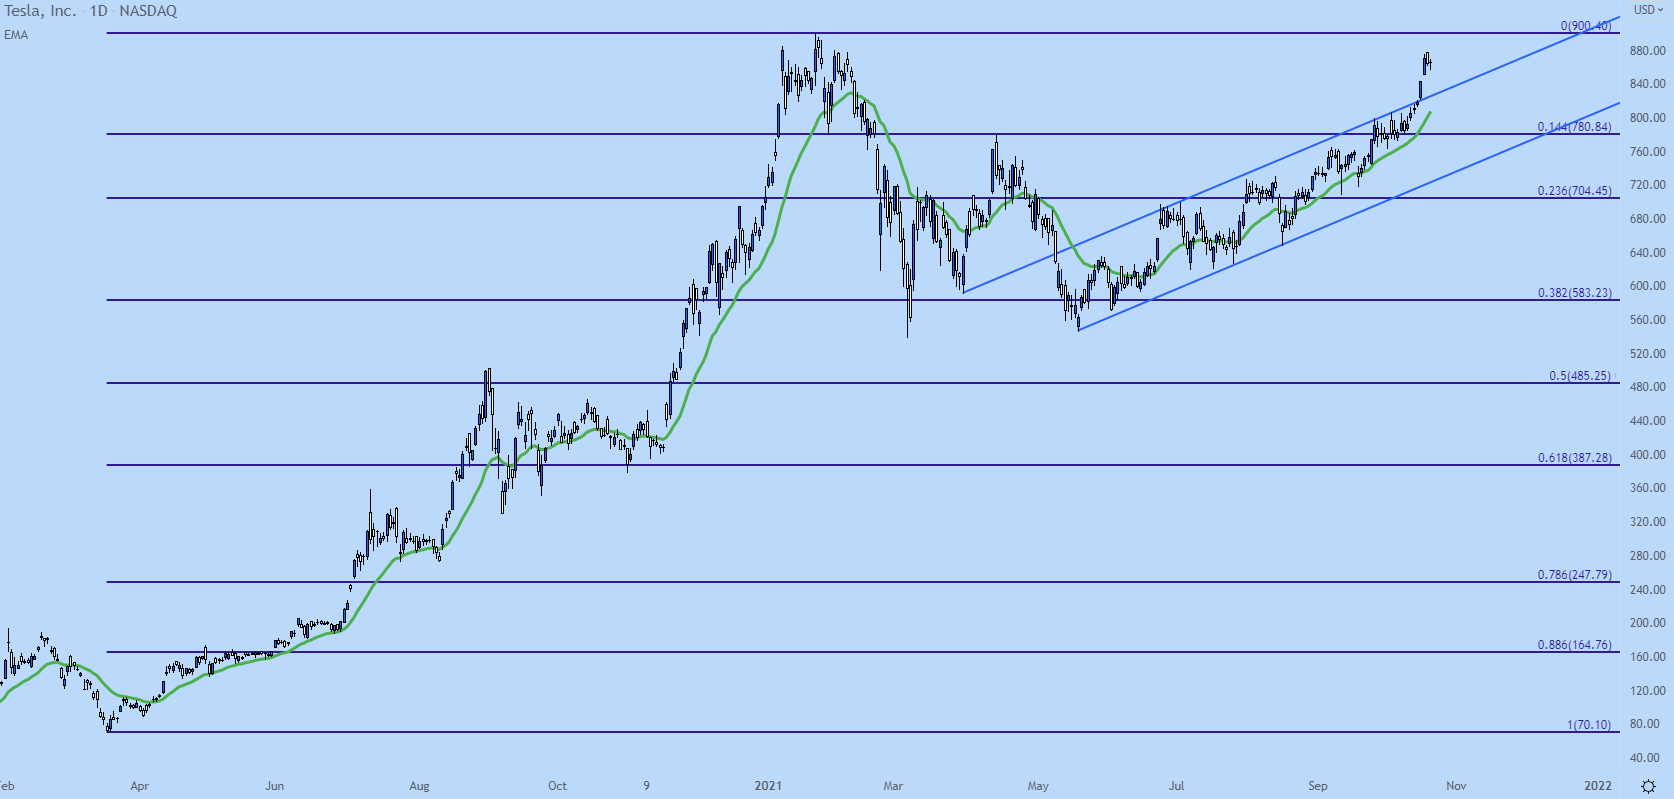
Chart prepared by James Stanley; TSLA on Tradingview
But, as oil prices started to break through those key resistance areas around 65 and then 70, Tesla caught a significant bid that continues to hold, with the stock now re-approaching the 900-level which currently marks the all-time-high for TSLA.
From an investment standpoint, getting long here could be challenging, particularly on a long-term basis given those extreme valuations. But, on a short-term basis and as indicated by the below chart, TSLA continues to bring the volatility. For traders focusing on volatility, a continued push towards green initiatives can keep TSLA on the move over the coming weeks and months.
--- Written by James Stanley and Christopher Vecchio, CFA, Senior Strategists


