


Micron (MU) Earnings Outlook:
- Micron has been caught in the crossfire of the US-China trade war
- Since the conflict began in June 2018, MU’s share price has been nearly cut in half
- MU is one of the first in the industry to report each quarter, offering early insight into the sector
Micron (MU) Earnings Outlook: US-China Trade War to Weigh
Semiconductor-manufacturer Micron (MU) will report their third quarter earnings on Tuesday and is one of the first in the sector to do so. The results will offer insight on the company’s own outlook, but also provide a glimpse at the themes impacting the industry. On a single-stock basis, expectations for Micron are low.

Source: Bloomberg
Trading just shy of $33.50 on Monday, MU shares have gained a meager 2.2% in the year-to-date. By comparison, the S&P 500, Nasdaq 100 and SOX Semiconductor ETF have climbed 11.6%, 21.7% and 21.5% respectively. The relative underperformance of Micron is due to a series of factors, of which the US-China trade war is arguably the most dominant - at present. Micron derives notable portions of its revenue stream from the world’s second-largest economy and tech is an area of heightened scrutiny in the ongoing trade war. Coupled with other industry-specific headwinds, Micron has delivered a series of cuts to its revenue and earnings estimates in recent quarters.

Data: Bloomberg
That said, the sentiment surrounding MU shares is bleak and expectations heading into earnings are on the floor. Still, implied volatility is heightened with a 1-day implied move of 8.4%. Across a broader timeframe, the 20-day implied volatility is particularly steep at 44% - likely due in part to the Trump-Xi meeting in Osaka, Japan.

From a technical perspective, MU trades near the bottom of its two-year range and just $5 above the lows tagged in late December. Within the implied price range, $32 may provide a modicum of support as it has throughout May and June. If the wheels really come off the bus, the December 26 low at $28.48 is the final point of buoyancy – but lies outside the 1-day implied price range.
Micron (MU) Price Chart: Daily Time Frame (June 2018 – June 2019)
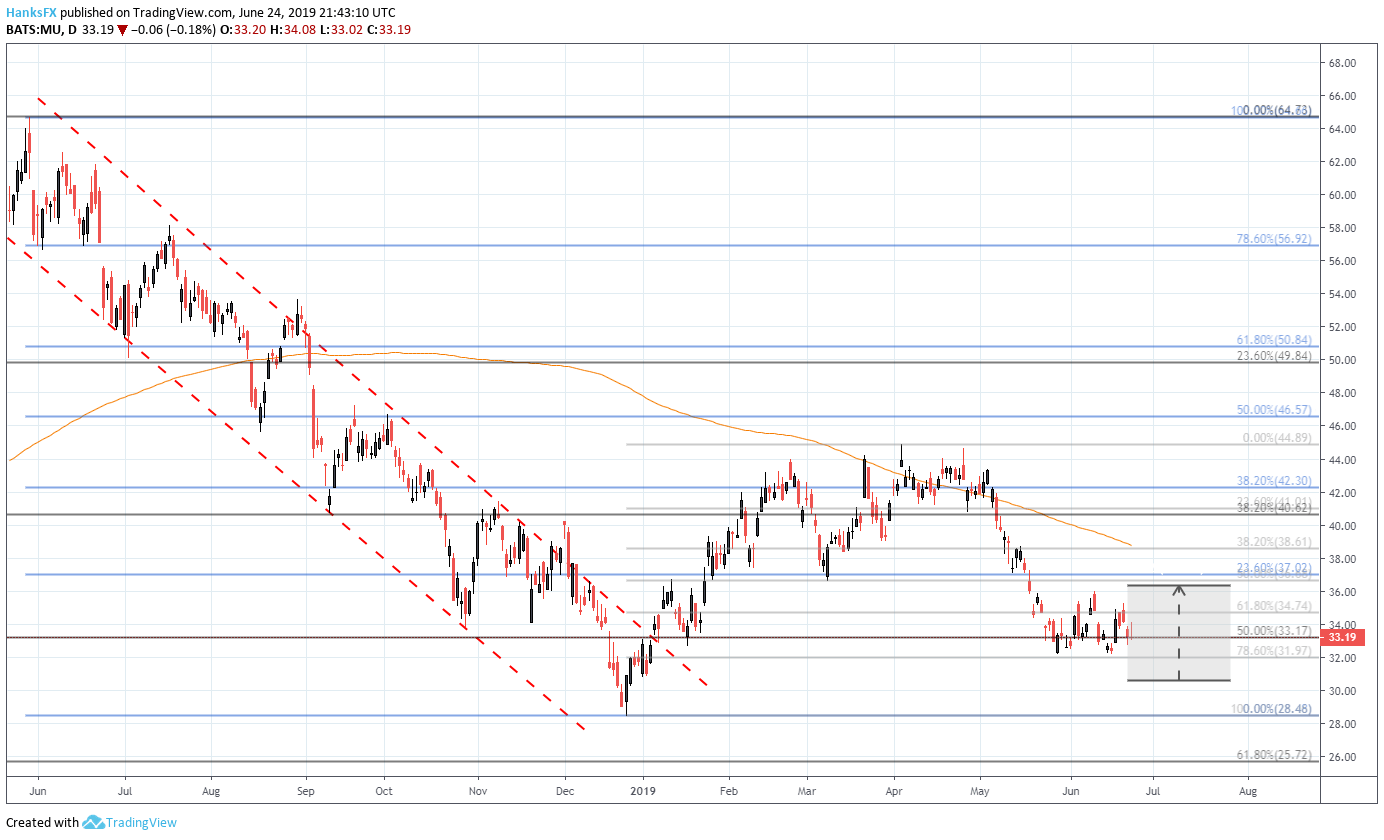
To the topside, the 61.8% Fib at $34.75 will offer resistance. Further, June’s swing high at $36 could come into play as a secondary barrier to a substantial bullish reaction. With substantial downward pressure and minimal expectations, Micron looks poised for yet another disappointing quarter.
With that in mind, the risk-reward perspective of a MU trade is somewhat unattractive. Should the company deliver even a sliver of hope for the coming quarter, it could result in a bullish reaction and punish shorts looking to capitalize off of the wounded stock. For updates and analysis on Micron and other tech stocks, follow @PeterHanksFX on Twitter
--Written by Peter Hanks, Junior Analyst for DailyFX.com
Contact and follow Peter on Twitter @PeterHanksFX
Read more: AUDUSD & Nasdaq 100 Price Outlook: Huawei Offers Opportunity


