


Fundamental Forecast for <USOIL>: Neutral
Fundamental Crude Oil Price Talking Points:
- The ONE Thing: Three makes a trend as Crude oil has pushed aggressively lower and the premium that had supported the market on near-term futures contracts continues to move toward zero.
- The correlation to WTI and stocks are coming at a bad time as stocks show their worst performance with a month-to-date loss of 7%. The S&P is having its worst month since February 2009, and the NASDAQ is working on its worst monthly decline since November 2008.
- Crude curves got crushed this week showing demand premiums on front-month contracts are near the point of inversion, which makes the bulls game a tough one to win.
- Per BHI, U.S. total rig count rose one rig to 1068 from 1067; US Oil rigs up two rigs to 875
- The technical picture: WTI uptrend holds at $66/bbl, and a weekly close below has heightened the risks that a reversal may be neigh or in the works. The monthly chart is showing momentum may be turning, which could set up a sharp move lower in coming months if demand doesn’t pick up fast.
“Buy when it’s cheap. If not then, when?” is a famous line from value investor James Montier. Of course, whether or not something is cheap is only obvious in the future or with the benefit of hindsight. What’s cheap can always get cheaper.
While this logic does not necessarily apply to crude, which is lower by 9% on the month, an experienced trader knows that you can lose 50% (please use stop losses, so this doesn’t occur,) on an investment that’s already lost 90% of its value. How? If something has fallen from $100 to $10, you buy it, and that asset drops to $5, you’ve lost 50%.
The question, of course is, where we are on crude oil? Things seemed positive just weeks ago. Crude was trading at a four year high, but just like the positive tech books have had a rude awakening this week, so to have those hopeful bulls of the energy complex. The Nasdaq 100 is down (as of writing) 11.9% on the month with Friday’s losses led by Amazon. The SPX500 as of Friday, fell 10% from the all-time high with the move this week.
There is a lot of similarities between stocks or growth and oil in that both are demand stories. This month, the correlation has jumped for SPX500 and WTI crude oil to the highest level since June when looking at the rolling 60-day relationship. Traders are looking at China, trade wars, Brexit, and overall concern of that growth’s best days are behind us.
Last week, we mentioned that for the first time in a while, spread between crude futures in the first two months (November 18 –December 18) is now showing a discount developing in the front-month contract compared to the second-month contract whereas, in early July, the premium for the front-month contract was as high as $2.57/bbl. Once again, we’ve seen a discount increase on the back of massive builds in US Crude Oil inventory to the tune of 635mln barrels.
The most popular calendar spread is the December 2018-December 2019 is trading at the narrowest levels in a year when it moved from a high of a $6.85/bbl premium on the front-month contract to a premium this week as low as $0.22/bbl. The falling premium tends to indicate concerns of oversupply, or in the narrative of this month, lower demand.
The Scariest Chart I’ve Seen in a While for Demand Bulls
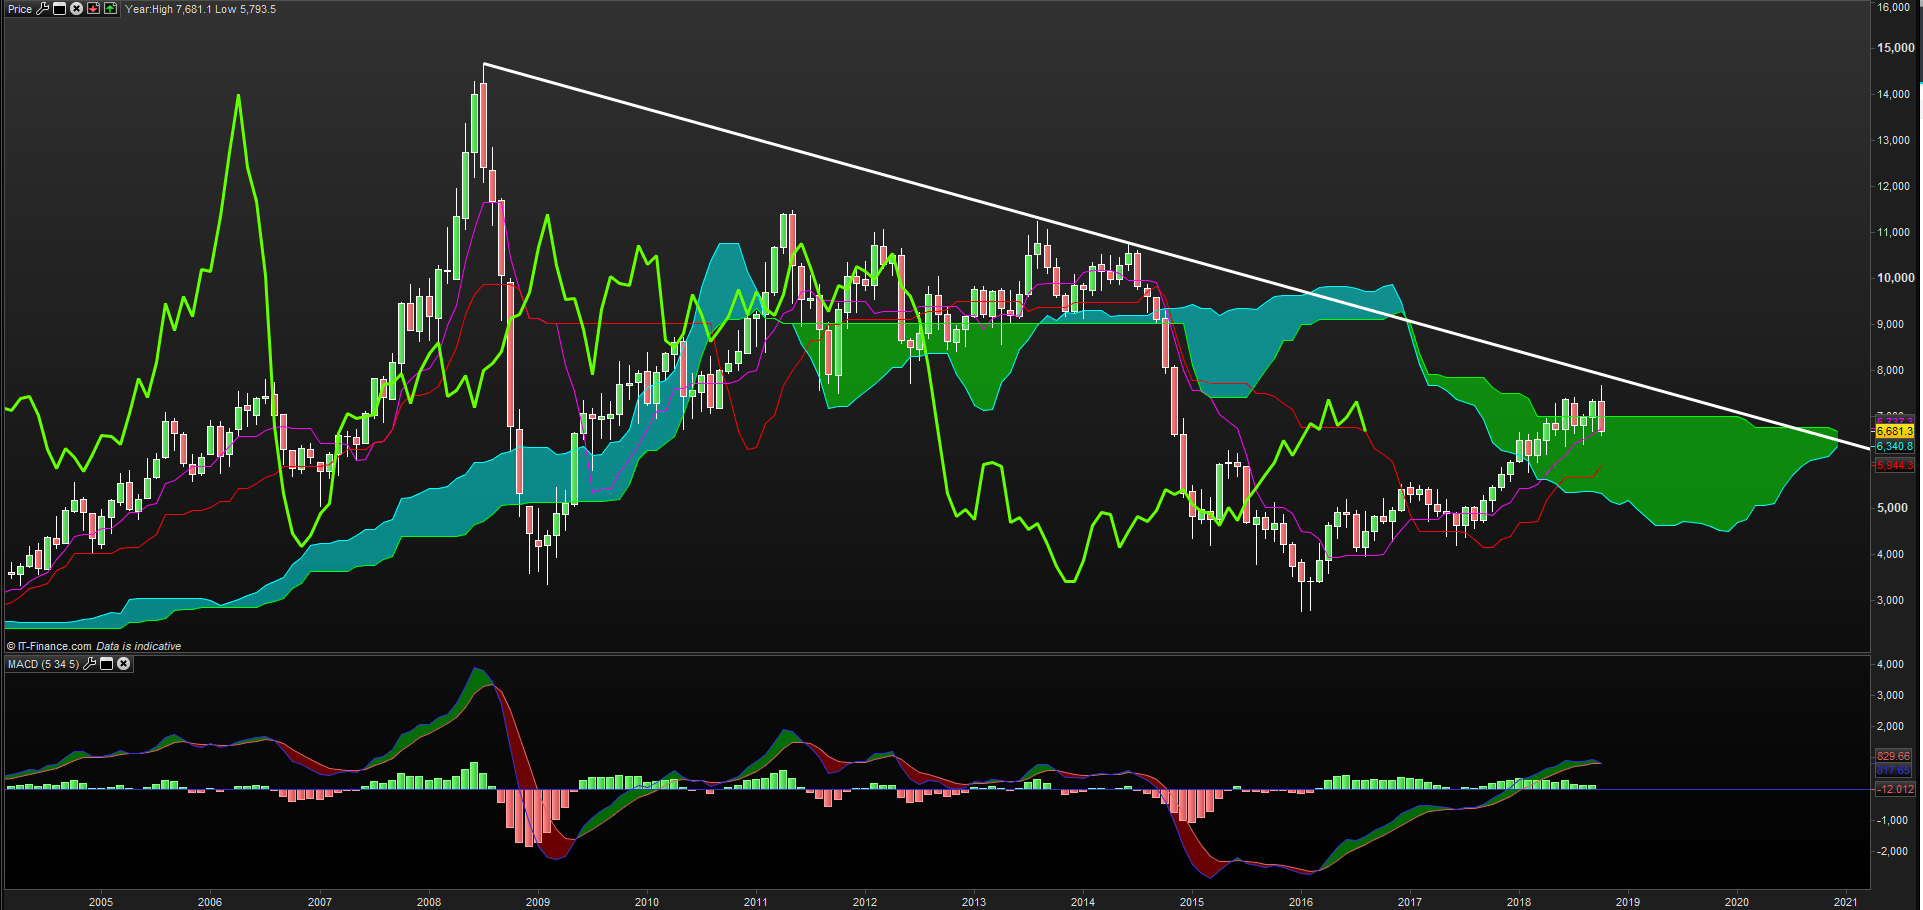
Chart Source: Pro Real Time with IG UK Price Feed. Created by Tyler Yell, CMT
This monthly chart should make crude bulls (I’m among them,) increasingly nervous. In short, the long-term trend since 2008 shows lower highs, and a trendline drawn off the 2008 and 2014 highs may prove too much for the current trend to overcome.
This chart has Ichimoku and MACD (5, 34, and 5) added show one of the most extended positive trends per MACD, which do not die of old age, but is looking tired. At the same time, the price has moved on the monthly chart to the Ichimoku Cloud (resistance) while the lagging line (bright green) are showing a possible corrective high, which would indicate, as described below that we could see a sharp move that would have improved odds of playing out on a close
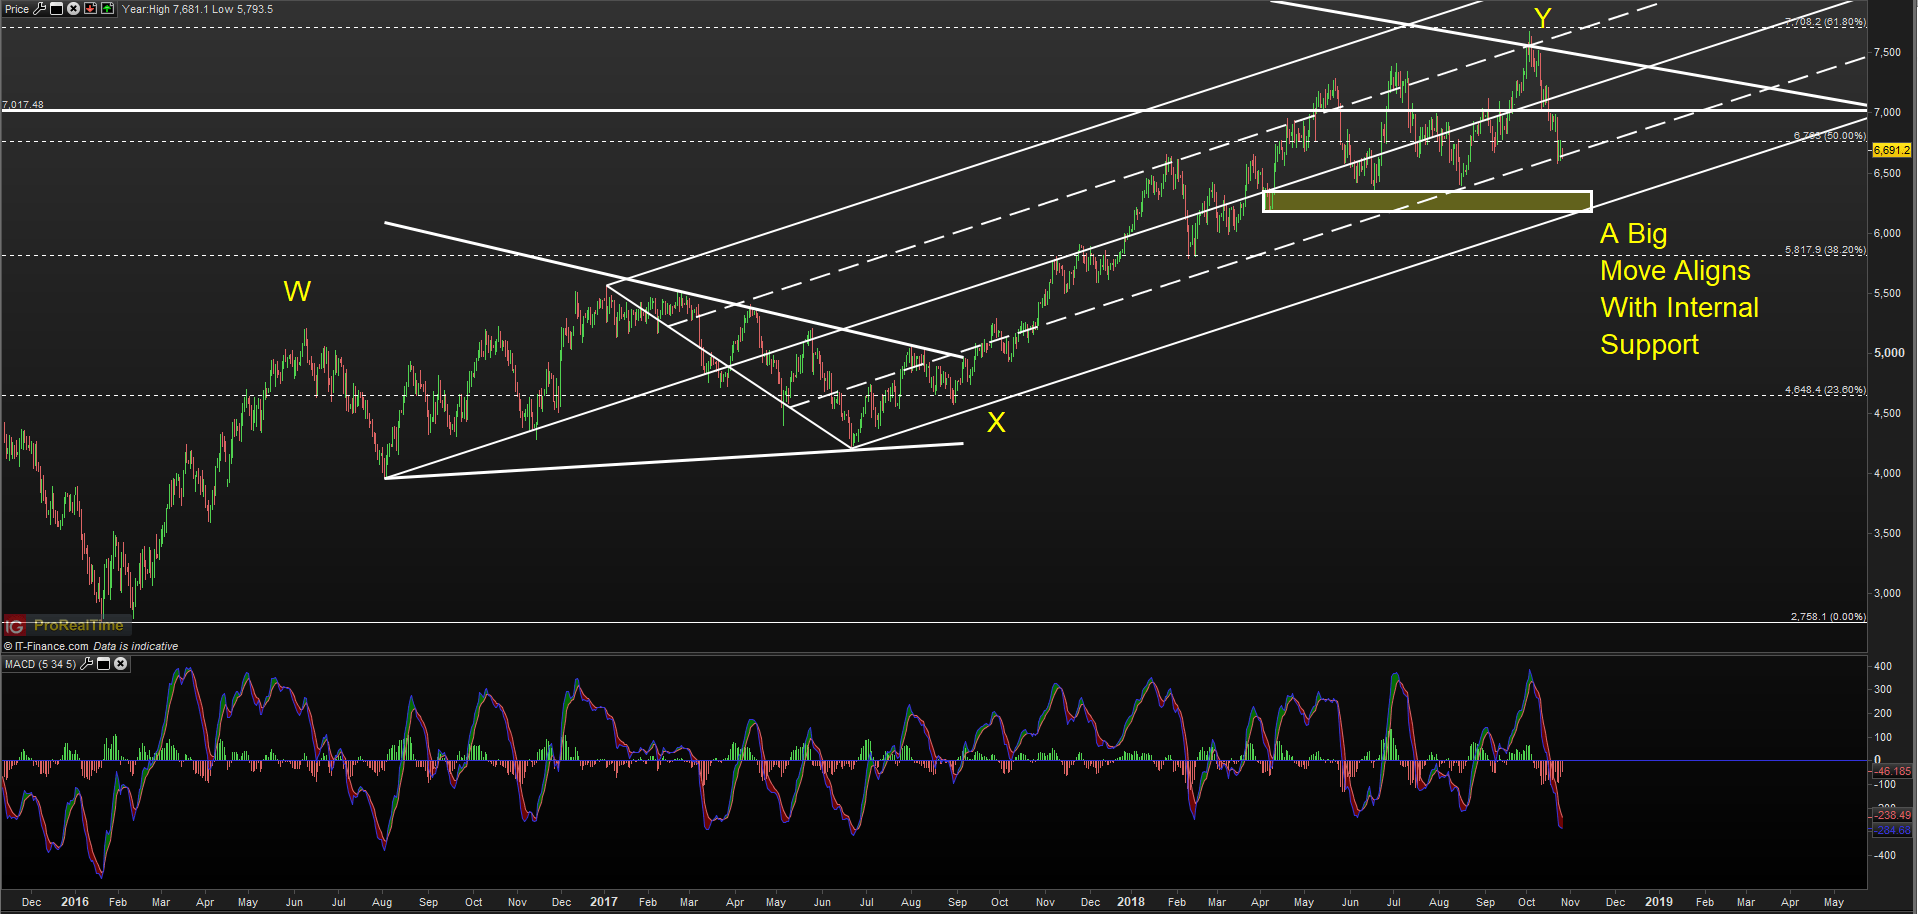
Daily Crude Oil Chart Shows a Sharp Drop to Internal Channel Support
Once again, WTI and Brent crude has become the market everyone is discussing! Unlock our forecast here
The above chart is best seen through the lens of the long-term chart shared earlier. The labels on the price chart are corrective waves in the discipline of Elliott Wave Analysis. Basically, the corrective wave labels show that the next sharp or impulsive move is likely lower if the recent corrective move has been higher. The shape and velocity of the move could be similar to the slope of the 2008 or 2014 move lower.
However, this would really be a more preferred view on a price break below the highlighted rectangle on the chart above at $63/bbl. A break below $63/bbl would take price out of the rising channel that the crude market has oscillated higher within since 2017, and would happen off of a 10yr falling trendline as seen on the first chart.
To keep traders confident of further upside, a hold above $66/bbl (this week’s low,) with a daily close above $70/bbl (38.2% of the monthly range) could argue that while sloppy, the uptrend is set to resume. However, the odds toward this outcome seem less and less likely.
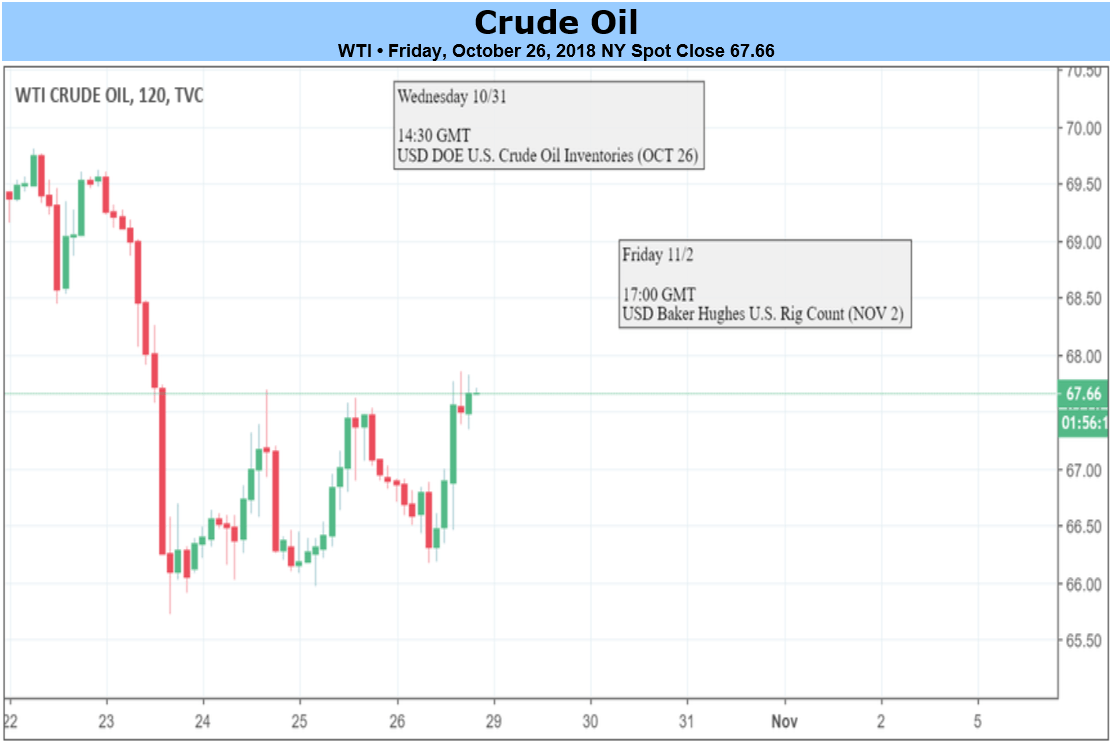
Next Week’s Data Points That May Affect Energy Markets:
The fundamental focal points for the energy market next week:
- Tuesday: Singapore International Energy Week, 1st day of 3
- Tuesday: Deloitte Oil & Gas Conference in Houston
- Tuesday 16:30 ET: API issues weekly US oil inventory report
- Wednesday: EIA’s Monthly Crude Oil and Natural Gas Production report
- Wednesday 10:30 ET: EIA weekly U.S. oil inventory report
- Friday 13:00 ET: Baker-Hughes Rig Count
- Friday 15:30 ET: Release of the CFTC weekly commitments of traders report on U.S. futures, options contracts
---Written by Tyler Yell, CMT
Tyler Yell is a Chartered Market Technician. Tyler provides Technical analysis that is powered by fundamental factors on key markets as well as trading educational resources. Read more of Tyler’s Technical reports via his bio page.
Communicate with Tyler and have your shout below by posting in the comments area. Feel free to include your market views as well.
Talk markets on twitter @ForexYell
Other Weekly Fundamental Forecast:
Japanese Yen Forecast - Yen Price May Rise, Look Past BoJ, Eye Vulnerable Stock Markets
Australian Dollar Forecast – Australian Dollar Might Get Some Respite If Inflation Holds Up


