Fundamental Forecast for Oil: Neutral with a Bearish Bias
- A classic example of ‘Buy the Rumor, Sell the Fact’.
- Oil may struggle to get back into its upward channel.
- Check out the DailyFX Economic Calendar and see what live coverage of key event risk impacting FX markets is scheduled for the week on the DailyFX Webinar Calendar.
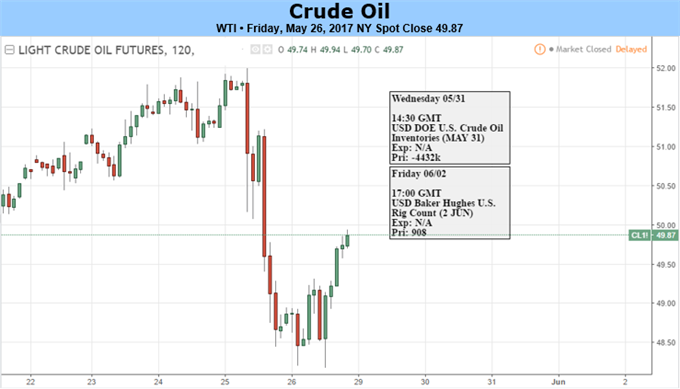
Oil slumped nearly 5% Thursday after OPEC announced that it would extend production cuts of 1.8 million barrels a day for another nine months, ending in June 2018. And while this would normally be taken as a bullish cue for the market, this extension had been mooted around the market since early May, taking the price of oil from a low of $46.72/barrel to a pre-release high of $54.87, a 17%+ rally in just over three weeks. With such a price rise already baked-in to market assumptions, it is no surprise to see the market falling back. And with US shale production hitting just under 10 million barrels a day, according to the latest US EIA data, upside movement in the oil complex may be capped.
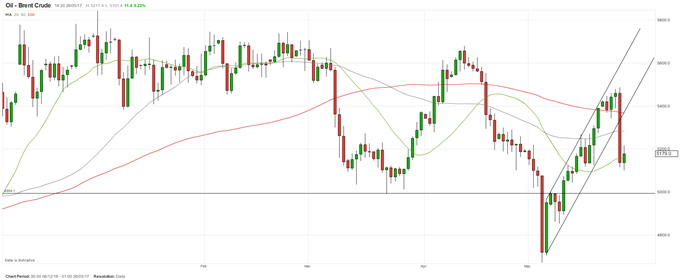
And the technical set-up looks slightly worrying as well. As the daily chart below shows, Brent has broken out of its sharp up channel that started on May 5, while the current price is also now below the 20-, 50- and 100-day moving averages, a potentially bearish set-up. To return to the up channel, Brent would need to move back above the 100-dma, currently around $53.70, while continued weakness could see the March 22 low of $49.92 the first target.
Chart: Oil Daily Timeframe (December 5, 2016 – May 26, 2017)

--- Written by Nick Cawley, Analyst.
To contact Nick, email him at nicholas.cawley@ig.com
Follow Nick on Twitter @nickcawley1
If you’re looking for trading ideas, check out our Trading Guides; they’re free and updated for the second quarter of 2017
If you’re looking for ideas more short-term in nature, check out the IG Client Sentiment Data


