


NASDAQ 100 OUTLOOK:
- Nasdaq 100 reversesearly losses and rallies into the market close despite the Federal Reserve’s hawkish pivot
- The FOMC keeps rates unchanged, doubles the size of its taper program, and signals that it will raise borrowing costs three times in 2022
- The upside move in stocks may fade in the near term once traders digest that the steep tightening cycle embraced by the central bank may undermine valuations
Trade Smarter - Sign up for the DailyFX Newsletter
Receive timely and compelling market commentary from the DailyFX team
Most read: Federal Reserve December Rate Decision – Key Points
The FOMC concluded Wednesday its last monetary policy meeting of 2021. In line with expectations, the institution led by Jerome Powell maintained the federal funds rate in its range of 0.00 - 0.25% to further support the economy as it pursues its dual mandate of maximum employment and price stability.
As for the quantitative easing program established in 2020 to counter the effects of the pandemic, the central bank decided to accelerate its exit strategy, doubling the pace of its taper to $30 billion a month starting in January, halting asset purchases by March, three months earlier than originally envisioned at the November gathering.
The faster transition away from accommodative policies comes as a response to improving labor market conditions, but more importantly to mounting inflationary forces, with Core PCE now seen at 2.7% in 2022 and 2.3% in 2023, up from 2.3% and 2.2% respectively in the September Summary of Economic Projections.
FOMC SUMMARY OF ECONOMIC PROJECTIONS (DECEMBER)
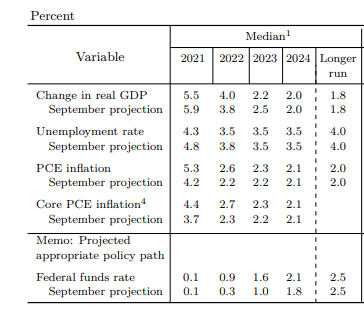
Source: Federal Reserve

In its press conference, Powell echoed concerns about rising consumer prices, no longer addressing the trend as “transitory” and indicating that its outlook has worsened amid the reopening of the economy and supply and demand imbalances linked to the health crisis.
Upside risks to the inflation profile and the jobs marketrapid recovery led the central bank to bring forward the lift-off timeline, front-loading rate hikes next year. That said, the updated dot-plot showed that the FOMC is nowleaning to increase borrowing costs three times in 2022, a much more aggressive tightening cycle than envisioned in September when policymakers saw only half a hike(the latest forecasts also signaled that Fed officials foresee another three rate increases in 2023 and two more in 2024).
Related: DAX and CAC Technical Outlook - Weakness is Bringing Support in Focus
The hawkish pivot out the FOMC meeting, which initially exerted strong upward pressure on short-term Treasury yields, failed to trigger a negative reaction in risk assets; on the contrary, stocks rallied after the event’s conclusion on bets the U.S. economy is in a good position to withstand tighter monetary policy expected over the forecast horizon. The Nasdaq 100, for example, managed to erase a 1% drop, finishing sharply higher near the 16,300 mark.

With the FOMC event out of the way, the retail crowd may be tempted to believe that the recent sell-off has entirely run its course and that a Santa rally is around the corner. However, traders should exercise caution over the next few weeks, as the worst may not be over yet.
When Wall Street completely digests the latest information and realizes that the steep normalization trajectory embraced by the central bank is not great news for valuations and may result in a flatter curve just as the economy slows, volatility may return with a vengeance, hurting stocks, especially expensive companies with lofty earnings multiples.
From a theoretical standpoint, higher borrowing costs undermine valuations by increasing the rate at which future cash flows are discounted, a conventional technique to price equities. The resulting pressure is more pronounced for technology and unprofitable growth plays that depend on cheap credit and whose valuations rely primarily on down-the-road profits. In this regard, the prospect of tighter monetary policy makes the Nasdaq 100 the most vulnerable index to large pullback among the major averages, while the blue-chip and value-oriented Dow Jones Industrial Average may be least sensitive. Having said that, it wouldn’t be inconceivable to see traders and speculators fade the recent rally to book profits in anticipation of some turbulence before year-end, a period when lower liquidity can amplify downside or upside moves.

NASDAQ TECHNICAL ANALYSIS
The Nasdaq 100 continued its recovery on Wednesday, rising 2.35% to 16,289, after the FOMC decision failed to spark a bearishresponse among risk-assets. If positive sentiment prevails in the coming sessions, the price could attack horizontal resistance at 16,400, an area where a pullback is likely, unless buyers manage to push higher, in which case the index could be on track to retest its all-time high near 16,765.
On the flip side, if traders start to fade the rally and selling activity jumps, the Nasdaq 100 could potentially correct lower, dropping towards trendline support at 15,750. If this technical floor is ultimately breached, bears could take decisive control of the market, setting the stage for a retracement towards 15,500, before targeting the 15,200.
NASDAQ 100 TECHNICAL CHART
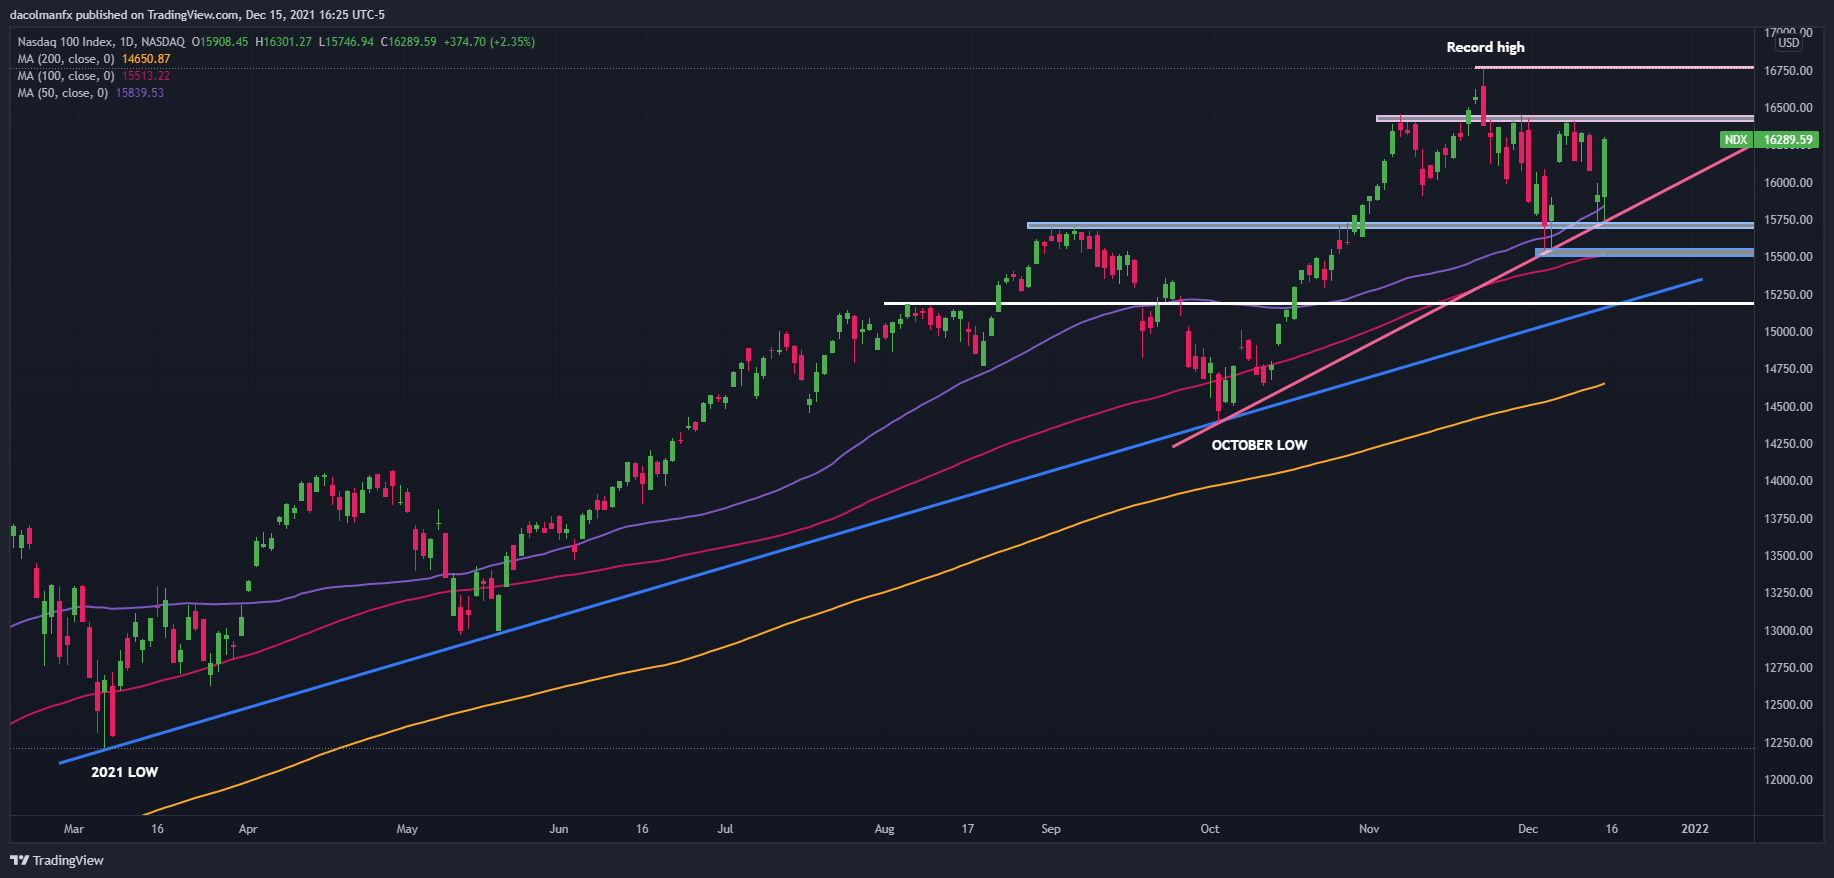
Nasdaq 100 (NDX) chart prepared in TradingView
EDUCATION TOOLS FOR TRADERS
- Are you just getting started? Download the beginners’ guide for FX traders
- Would you like to know more about your trading personality? Take the DailyFX quiz and find out
- IG's client positioning data provides valuable information on market sentiment. Get your free guide on how to use this powerful trading indicator here.
---Written by Diego Colman, Contributor


