


NASDAQ AND ARKK OUTLOOK:
- U.S. stocks fall sharply on Tuesday pressured by rising Treasury yields
- The Nasdaq 100 Index, and tech and growth stocks in general, bear the brunt of the sell-off
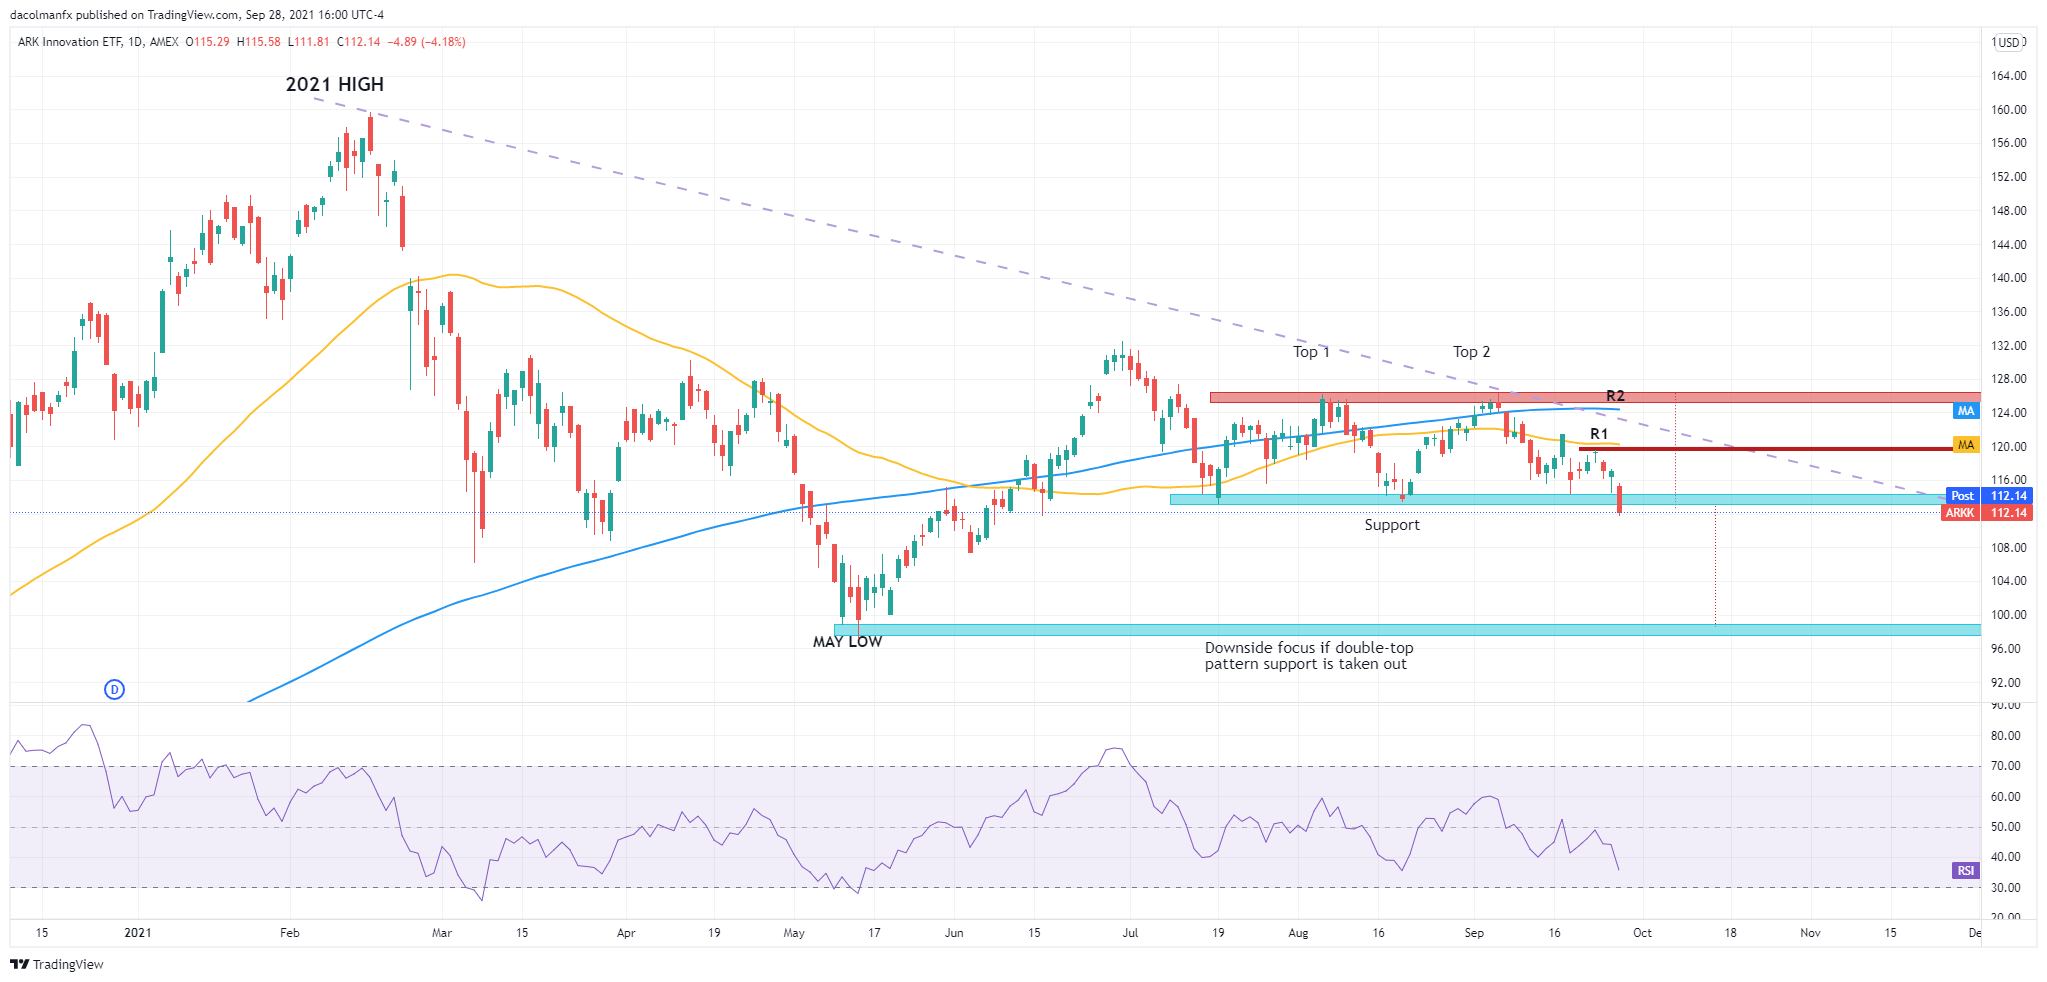
- ARKK appears to validate a bearish double-top technical pattern
Trade Smarter - Sign up for the DailyFX Newsletter
Receive timely and compelling market commentary from the DailyFX team
Most read: Gold Prices Fall as Rates Rise, XAU/USD Nearing Support
The U.S. equity market slumped on Tuesday, hit by risk-averse mood, after September consumer confidence fell to the lowest level since February and lawmakers in Washington continued to struggle to reach a deal to lift the debt-ceiling. Concurrently, the swift increase in U.S. Treasury yields also weighed on sentiment, putting pressure on rate-sensitive stocks such as technology.
At the market close, the S&P 500 tumbled 2% to 4352 while the Nasdaq 100 plummeted 2.9% to 14770, suffering its worst day since March. Meanwhile, ARKK, an ETF characterized by disruptive growth investment, plunged 4.2% to 112.14, breaking a key technical support and validating a double top formation.
When bond yields rise, companies’ future earnings are worth less in the present after discounting them at a higher rate. This can be detrimental to technology and growth stocks with exorbitant valuations and longer duration cash flows. At the same time, rising yields make bond investments more attractive, discouraging assets with a riskier profile.
For context and to add some color to the situation, yields have risen rapidly since last week after the Federal Reserve indicated that it may be appropriate to start tapering asset purchases soon and signaled, via its dot-plot, that the bank could raise the federal funds rate as soon as 2022. With the FOMC getting ready to unwind its crisis-era stimulus in the face of elevated inflationary pressures, the 10-year yield has climbed from a low of 1.29% before the September policy meeting to a high of 1.56% today, a significant increase over a very short period of time.
Although current rates across the Treasury curve remain low by historical standards, the speed of the upside move witnessed recently is worrying and nerve-wracking, as it may accelerate forced hedging and some rebalancing activity. In any case, if the trend does not slow, undesirable portfolio adjustments and rotation out of pricey and high-flying stocks could weigh on the tech sector heading into the fourth quarter. Needless to say, a higher rate regime could hurt the Nasdaq 100 and, of course, the ARKK ETF in the near-term.

ARKK TECHNICAL ANALYSIS
Last week I discussed a double top pattern developing on ARKK’s daily chart. With the latest retracement, the technical formation appears to have been validated after price breached the 113 support, but to have more confidence in the bearish narrative, conservative traders may want to look for a weekly close below that level. Should ARKK hold below 113 on a sustained basis, selling pressure could accelerate in the near term, potentially triggering a move toward the May low (this downside area of interest is obtained by projecting the approximate height of the double top pattern from the breakout point). Alternatively, if bulls regain the upper hand and we see a move above 113, the 50-day moving average near 120 would become an area of interest, followed by the 200-day moving average, just below the August and September high.

ARKK TECHNICAL ANALYSIS
EDUCATION TOOLS FOR TRADERS
- Are you just getting started? Download our beginners’ guide for FX traders
- Would you like to know more about your trading personality? Take our quiz and find out
- IG's client positioning data provides valuable information on market sentiment. Get your free guide on how to use this powerful trading indicator here.
- Subscribe to the DailyFX Newsletter for weekly market updates and insightful analysis
---Written by Diego Colman, DailyFX Market Strategist


