


Copper Price Outlook:
- Copper prices have almost staged a meaningful recovery in July. Just not quite yet as more technical resistance remains overhead.
- The demand side hasn’t recovered since news out of China that the government would release industrial metals stockpiles to cool their respective rallies.
- Trading is a function of both price and time; the technical uncertainty can be resolved either through a correction in price action or more sideways chop.
Minor Recovery Thus Far
Ever since late-May, when news has emerged from China that officials would take steps to curb “unreasonable” price appreciation in industrial metals by releasing inventories, copper prices have been under pressure. But with the drop in US Treasury yields alongside US equity markets pushing to fresh record highs (again), risk appetite is on the up-and-up, offering narrative relief for embattled copper prices.
But the fact remains that the fundamental picture specific to copper prices hasn’t gotten any better either: according to Reuters, “on-warrant inventories of copper in LME-registered warehouses have jumped to their highest since May 2020, while Yangshan premiums of the metal going into China languished.”
In other words, demand has yet to absorb all of the recent additional supply. The gains seen since late-June have only proved to amount to a minor recovery thus far, as a cluster of technical resistance lingers ahead.

COPPER PRICE TECHNICAL ANALYSIS: DAILY CHART (March 2020 to July 2021) (CHART 1)
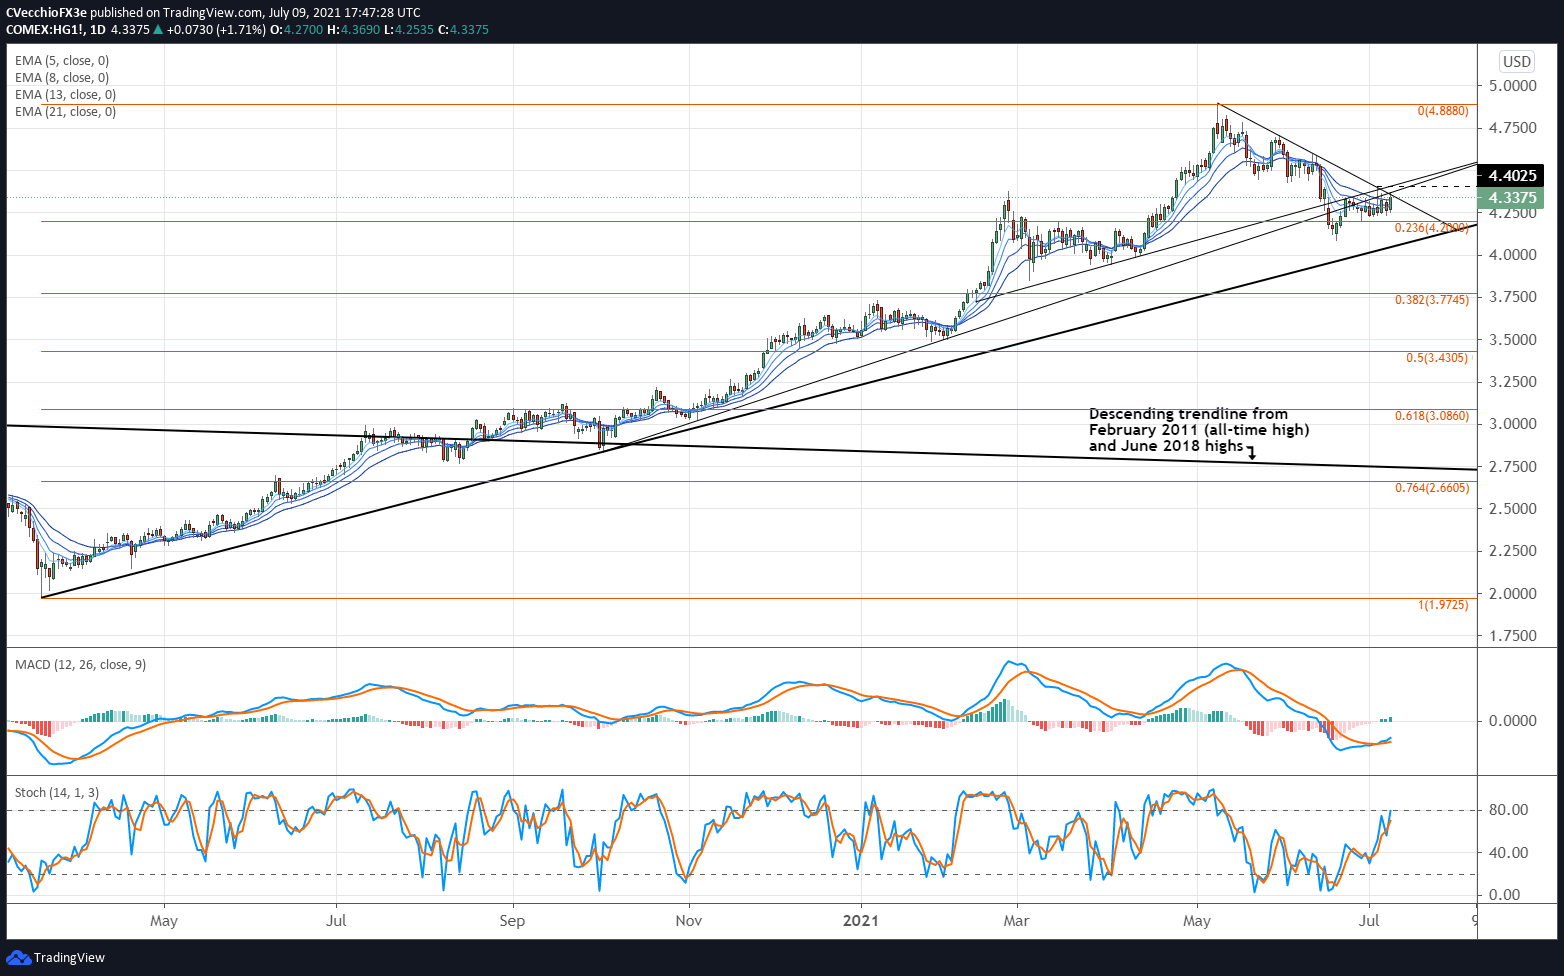
In late-May, it was noted that “a return back to the former yearly high established in February at 4.3755 may be on the horizon before buyers step back into the market.” Copper prices briefly crashed below the former high at the end of June, but in the first week of July the level was once more reclaimed after price rebounded ahead of the 23.6% Fibonacci retracement of the 2020 low/2021 high range at 4.2000.
For now, momentum indicators are still working off recent oversold conditions. Copper prices are above their daily 5-, 8-, 13- and 21-EMA envelope, but not yet in bullish sequential order. Daily MACD is trending higher but remains below its signal line, while daily Slow Stochastics have already on the verge of returning into overbought territory.
Lingering just below the February 2021 high of 4.3755, it appears that a confluence of resistance remains ahead: the July high at 4.4025; the ascending trendline from the late-February and March swing lows; and the ascending trendline from the September 2020 and February 2021 swing lows. Breaching this confluence of resistance would put copper prices on more confident bullish footing henceforth.
COPPER PRICE TECHNICAL ANALYSIS: WEEKLY CHART (November 2008 to July 2021) (CHART 2)
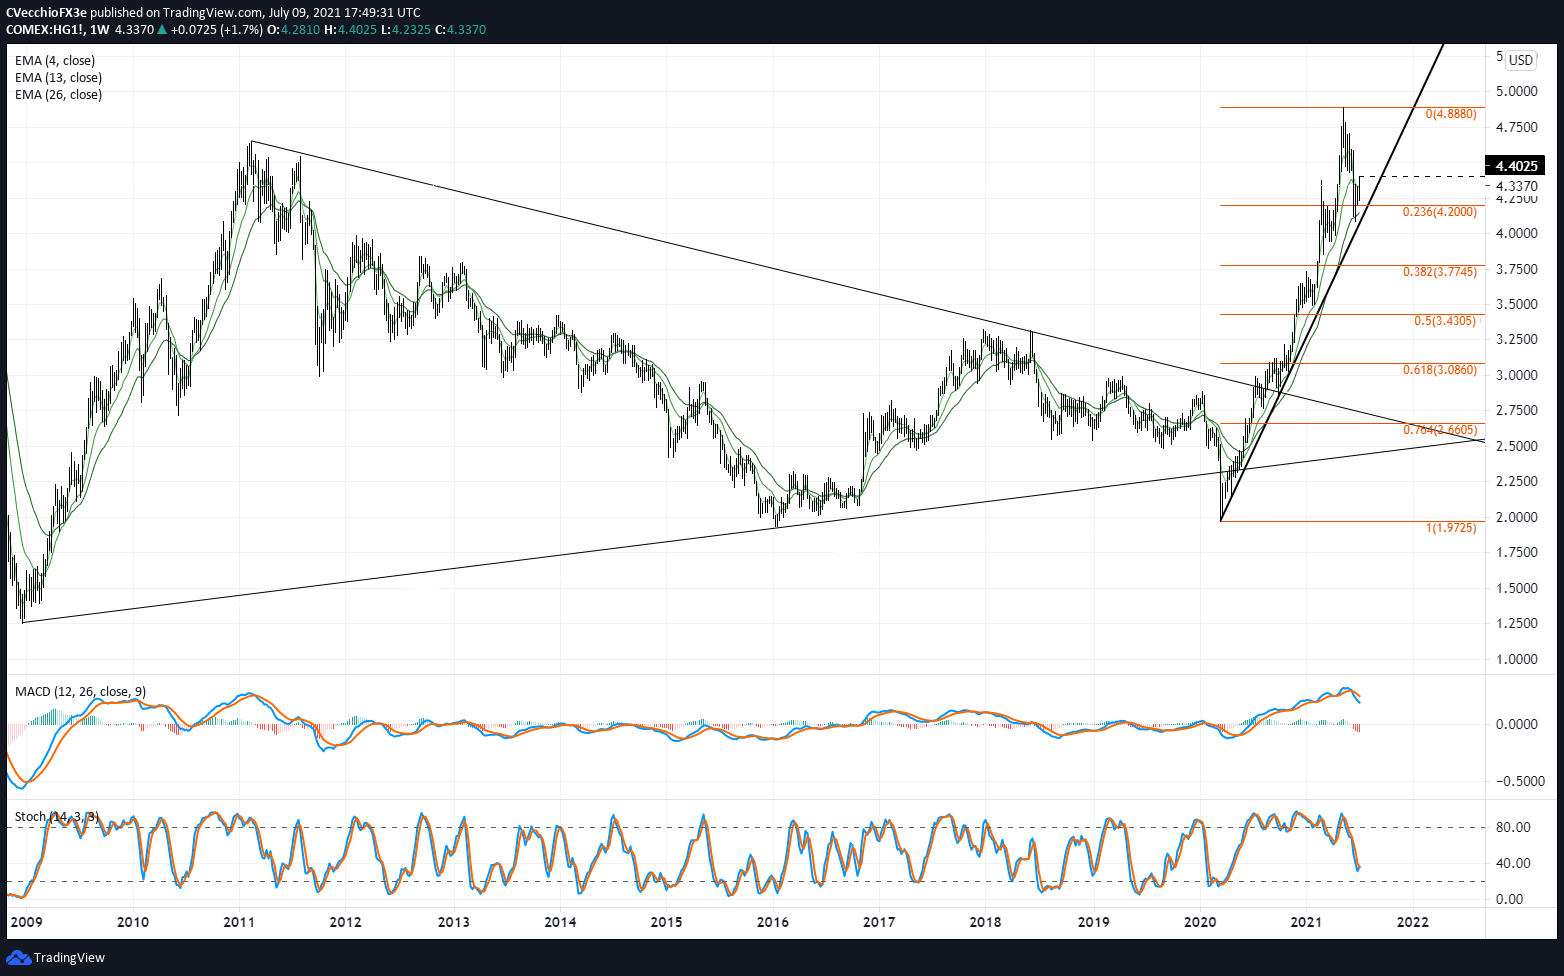
The perspective noted in mid-February remains valid: “Copper prices’ breakout above the descending trendline from the February 2011 and June 2018 highs suggests that a multi-year bottoming process commenced in mid-2020. This point of view is reinforced by the failed bearish breakout in early-2020, which saw the multi-year symmetrical triangle support temporarily lost for a few weeks."
"Clearing the June 2018 high officially ended the multi-year series of ‘lower highs and lower lows.’ As long as the uptrend from the March and October 2020 swing lows is maintained, copper prices retain a bullish bias.”

--- Written by Christopher Vecchio, CFA, Senior Currency Strategist


