Crude Oil Outlook Talking Points:
- WTI crude oil prices have bounced from fresh seven-week-lows set last week.
- Sellers have shown-up to offer resistance around a prior area of support – can oil bears continue to push prices to fresh lower-lows?
- At issue around crude oil right now is whether China ignores US sanctions on Iranian oil, which could create even more pressure on the offer of oil prices.
Crude Oil Bounce From Fresh Lows, Finds Resistance
Another day another driver in crude oil prices. While June and the first-half July saw a semblance of support develop after a brutal month of May, the past few weeks, particularly the period after the FOMC rate cut, have seen a return of bears as prices have pushed down to a fresh seven-week-low. This happened last Thursday night after the announcement from President Donald Trump of additional tariffs levied on China. The news had near-immediate impact on global markets as USD-weakness showed up (and still has yet to go away); and this weekend saw the initial response out of China when the PBoC aggressively weakened the Yuan beyond the psychological 7.000 barrier against the US Dollar.
This highlights another potential worry around oil prices at the moment: Will China look to further respond to increased tariffs by skirting US sanctions on Iranian oil? Such an undertaking could serve to further hit oil prices if it does come to fruition, exacerbating the demand-based concerns that have kept the pressure on the offer for oil prices over the past few months.
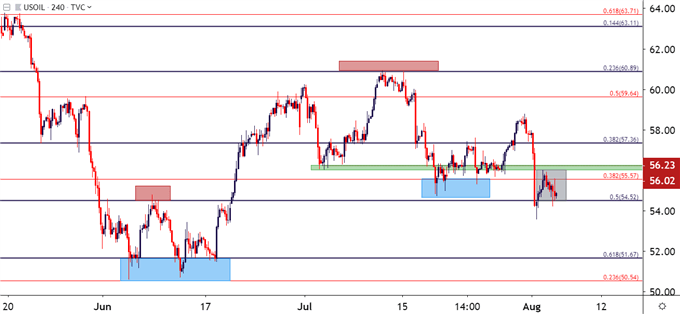
At this stage, WTI crude is testing a key zone on the chart. This runs between Fibonacci levels at 54.42, or the 50% retracement of the December-April bullish run, and 55.57, which is the 38.2% retracement of the December-April major move. This zone, along with the 55-handle, helped to arrest the July decline as hopes were building for a very dovish FOMC outlay that may have produced 50 basis points of cuts at the most recent rate decision. That didn’t happen, of course, and the 25 basis point cut combined with the increased tariff announcement on China that took place less than 24 hours later have created swells of risk aversion across global markets, oil included.
WTI Crude Oil Four-Hour Price Chart

Chart prepared by James Stanley; Oil on Tradingview
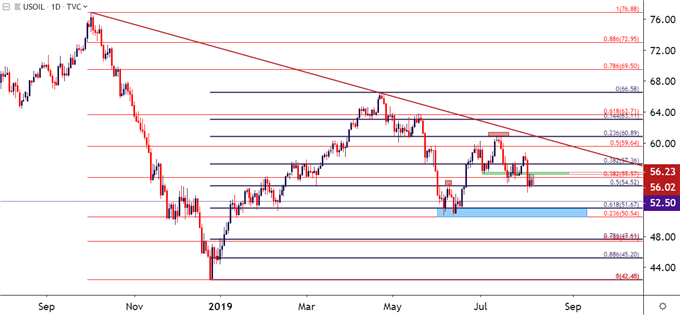
Taking a step back on the daily chart and current support becomes a bit more clear, as the Fibonacci level at 54.42 has helped to cauterize the past three days’ decline. But – at this point bulls haven’t been able to make much ground as resistance has continued to show around 56 or lower. This can help to keep the focus on the short-side of the move, targeting the support zone that came into play in early-June around the 51-handle. On the way to that support, nearby target potential exists around the 52.50 psychological level. If the 51 zone and the 50 psychological level are taken-out in short-order, a confluent zone of support potential exists around the 47.50 area on the chart.
WTI Crude Oil Daily Price Chart

Chart prepared by James Stanley; Oil on Tradingview
Crude Oil Strategy – Timing the Bearish Approach
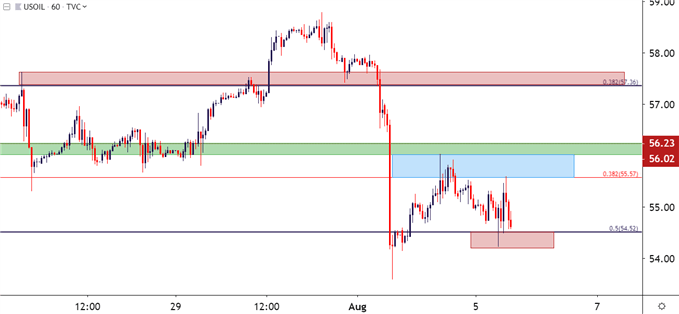
Given the build of support in the current zone, traders would likely want to wait for matters to clean up before taking-on fresh exposure. This can be accomplished in one of a couple different ways: Bearish breakout logic could be used on the print of fresh lows, whether that be below the 54.42 level or the 54.23 price that currently marks this week’s swing-low.
Alternatively, short-term resistance could be sought out inside of this longer-term zone, similar to what showed earlier this morning when sellers reacted to resistance at 55.57. Traders can look for a bounce back towards the 55 psychological level, coupled with a show of seller resistance as indicated by upper wicks on the hourly chart, to look for short-side swing potential. If buyers are able to pose a stronger pullback, longer-term resistance potential could be followed around the 57.50 level for similar bearish swing strategies.
WTI Crude Oil Hourly Price Chart

Chart prepared by James Stanley; Oil on Tradingview
To read more:
Are you looking for longer-term analysis on the U.S. Dollar? Our DailyFX Forecasts have a section for each major currency, and we also offer a plethora of resources on Gold or USD-pairs such as EUR/USD, GBP/USD, USD/JPY, AUD/USD. Traders can also stay up with near-term positioning via our IG Client Sentiment Indicator.
Forex Trading Resources
DailyFX offers an abundance of tools, indicators and resources to help traders. For those looking for trading ideas, our IG Client Sentiment shows the positioning of retail traders with actual live trades and positions. Our trading guides bring our DailyFX Quarterly Forecasts and our Top Trading Opportunities; and our real-time news feed has intra-day interactions from the DailyFX team. And if you’re looking for real-time analysis, our DailyFX Webinars offer numerous sessions each week in which you can see how and why we’re looking at what we’re looking at.
If you’re looking for educational information, our New to FX guide is there to help new(er) traders while our Traits of Successful Traders research is built to help sharpen the skill set by focusing on risk and trade management.
--- Written by James Stanley, Strategist for DailyFX.com
Contact and follow James on Twitter: @JStanleyFX


