

Gold Price Talking Points:
- Gold prices have been on the move over the past two weeks as expectations for rate cuts from the FOMC have gotten priced-in. But this may not be just a near-term stimuli, as Gold prices were setting the stage for a significant breakout coming into last month.
- Gold prices hit a fresh yearly high earlier this morning, finding a bit of resistance off of a big batch of prior swing highs that I had previously called ‘the danger zone.’
- DailyFX Forecasts are published on a variety of currencies such as Gold, the US Dollar or the Euro and are available from the DailyFX Trading Guides page. If you’re looking to improve your trading approach, check out Traits of Successful Traders. And if you’re looking for an introductory primer to the Forex market, check out our New to FX Guide.
Gold Prices to Fresh Yearly Highs
It’s been a brisk month of June already for Gold prices. After spending much of the prior three months in varying forms of consolidation, the past two weeks have seen a significant topside ramp develop as a number of macro themes have moved into the spotlight.
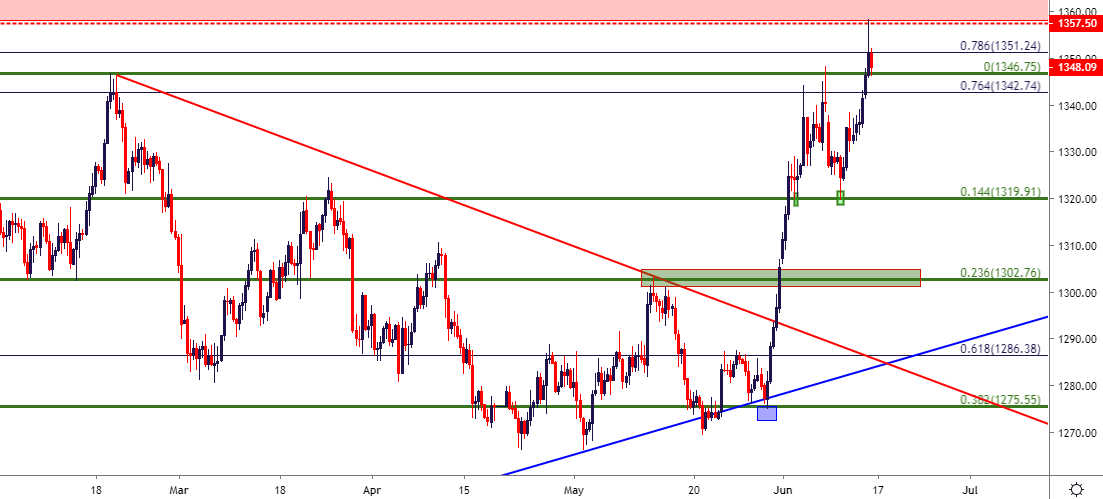
Last week, I had looked at support potential in Gold prices, taken from around the 1319.91 Fibonacci level. This is the 14.4% retracement of the same major move from which the 38.2% marker helped to set pre-breakout support around the 1275 handle. The 14.4% retracement came into play again early this week, and the bounce from that level has now extended up to fresh yearly highs, finding sellers in the ‘danger zone’ that was looked at on Tuesday.
Gold Price Eight-Hour Chart
Gold Price Breakout – Is Now the Time for Fresh Five-Year-Highs?
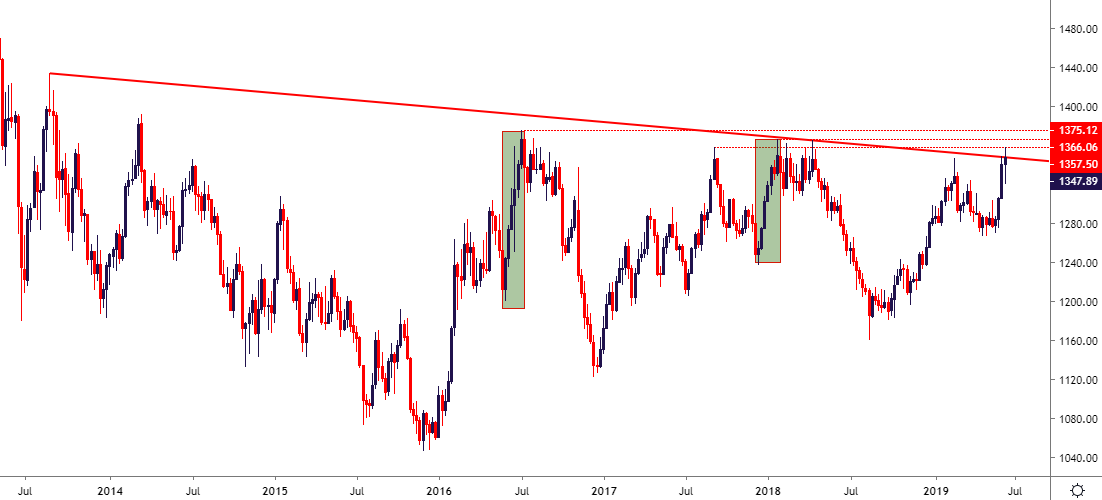
Given the excitement on Gold charts, and rightfully traders have started to look at the bigger picture. As discussed on Tuesday, Gold prices are nearing a long-term zone of resistance that lurks just above current price action, and this is a zone that’s turned around multiple advances in the recent past. A similar theme of strength had shown in Gold prices from July to September of 2017; and another from December 2017 to January 2018. Each of those advances was decidedly one-sided, but both failed to push through this key zone on the chart.
The operable question right now is whether ‘this time is different?’ And to seasoned traders, that’s often a phrase of folly. But it does highlight the inherent danger of chasing a well-developed move as a long-term zone of resistance has just come back into play.
Gold Price Weekly Chart
Gold Prices React to Shifting Rate Paradigm – But Will the Fed Deliver?
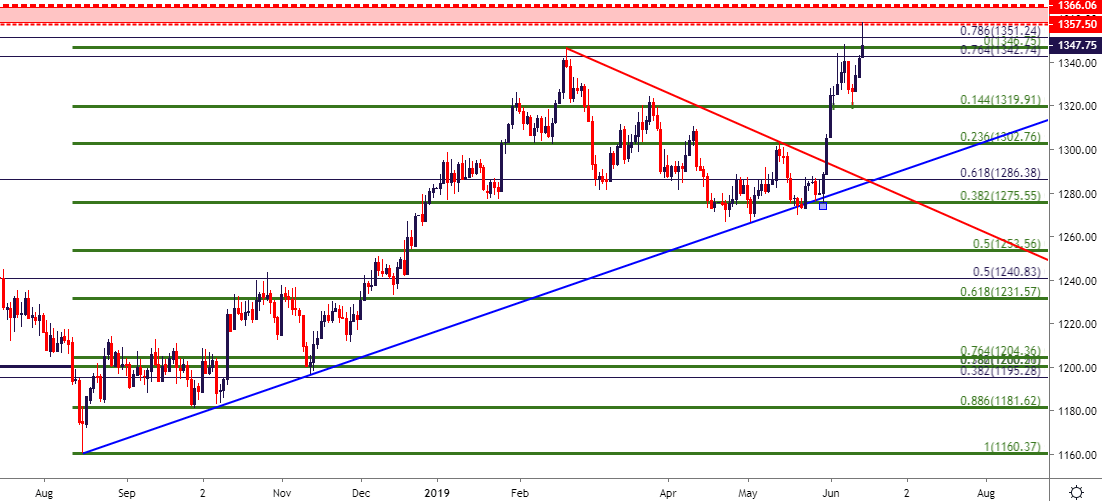
One of the key components of this current topside run in Gold prices has been a shifting backdrop around rate expectation in the US. As the Fed remained hawkish through much of last year, Gold prices tanked from April to August, finally finding a bit of support around the 1160 level. But as pressure began to show in risk markets throughout Q4, expectations for Fed tightening diminished, and bulls came back in to push the bid in Gold. That theme ran into the month of February when digestion began to show up; and price action put in a 38.2% retracement of that prior bullish move, bringing into play the support level two weeks ago at 1275.15.
Gold Price Daily Chart
Gold Price Strategy Moving Forward
At this point, pushing the bid on Gold appears to be aligned with anticipation of a very dovish twist at the Federal Reserve for next week’s rate decision. Rates markets are anticipating three cuts by the end of the year, with the next move being a 25 basis point cut that’s expected at the July meeting. So, the primary focus around this upcoming FOMC rate decision will be on the dot plot matrix, and just how dovish the Fed might go in response to this recent flicker of risk aversion.
The Fed may have their work cut out for them at Wednesday’s rate decision. While economic data has taken a negative tone of late, inflation remains very near the bank’s 2% goal and this morning’s retail sales data was rather strong. And while this backdrop, particularly if focusing on the dual-mandate, may be ripe for keeping rates on hold, it does make for a more difficult case to justify a full-on rate cut regime.
This could mesh well with the current backdrop in Gold prices. The bullish move is stretched by a number of metrics, but that longer-term zone of resistance could soon be taken-out when the Fed does eventually deliver. This may be more probabilistic at their next rate decision, however, taking place in late-July. For next week, this places emphasis on support potential in Gold prices, and that same 1319.91 level could remain as interesting, with the 23.6% marker of that same major move, taken from around 1302 as another potential support point. That price remains as interesting as it helped to provide a very clear swing-high in mid-May and, as yet, hasn’t been tested for higher-low support since the bullish breakout began two weeks ago.
Gold Price Four-Hour Chart
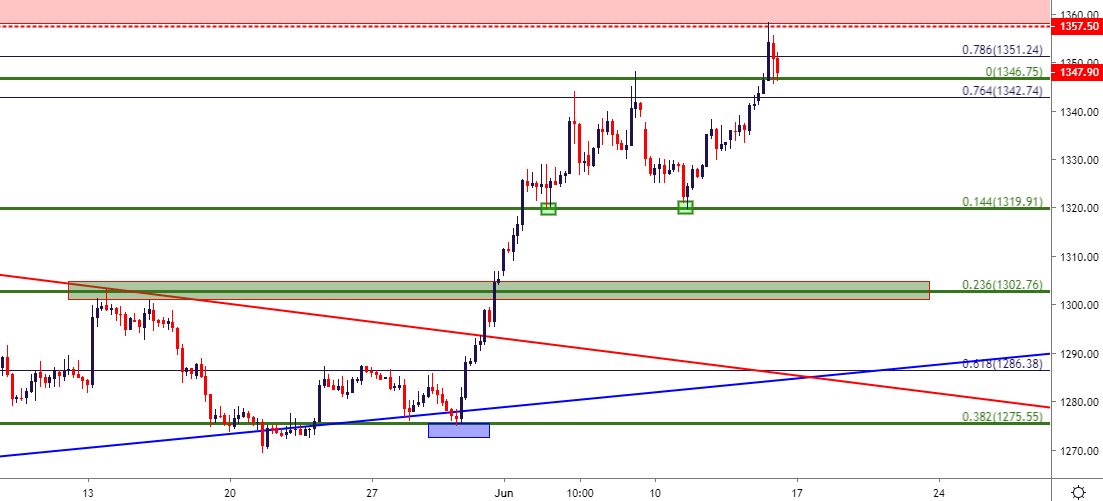
Chart prepared by James Stanley
To read more:
Are you looking for longer-term analysis on the U.S. Dollar? Our DailyFX Forecasts have a section for each major currency, and we also offer a plethora of resources on Gold or USD-pairs such as EUR/USD, GBP/USD, USD/JPY, AUD/USD. Traders can also stay up with near-term positioning via our IG Client Sentiment Indicator.
Forex Trading Resources
DailyFX offers an abundance of tools, indicators and resources to help traders. For those looking for trading ideas, our IG Client Sentiment shows the positioning of retail traders with actual live trades and positions. Our trading guides bring our DailyFX Quarterly Forecasts and our Top Trading Opportunities; and our real-time news feed has intra-day interactions from the DailyFX team. And if you’re looking for real-time analysis, our DailyFX Webinars offer numerous sessions each week in which you can see how and why we’re looking at what we’re looking at.
If you’re looking for educational information, our New to FX guide is there to help new(er) traders while our Traits of Successful Traders research is built to help sharpen the skill set by focusing on risk and trade management.
--- Written by James Stanley, Strategist for DailyFX.com
Contact and follow James on Twitter: @JStanleyFX