


Gold Price Outlook Talking Points:
- Gold prices have caught a strong bid over the past week, helped by a gust of selling in the US Dollar that’s pushed the US currency down to fresh seven-week-lows.
- Gold prices have thus far found resistance at a key Fibonacci level, and a bit-higher on the chart is a critical zone of resistance that’s held multiple tests over the past couple of years: Can bulls finally evoke a topside break through this very key area on the chart?
- DailyFX Forecasts are published on a variety of currencies such as Gold, the US Dollar or the Euro and are available from the DailyFX Trading Guides page. If you’re looking to improve your trading approach, check out Traits of Successful Traders. And if you’re looking for an introductory primer to the Forex market, check out our New to FX Guide.
Gold Breakout Takes Hold
Coming into the month of May, Gold prices had started to gear up for a large move. After Gold put in a six-month-trend of strength from August of last year into February of this year, the next two months were followed by pullback as 38.2% of that prior bullish move was retraced. But, it was around this Fibonacci retracement level that bulls started to come into play to help hold the lows, and that jostle lasted for most of the month of May.
Just last Wednesday, I looked at the potential for Gold prices to finally break out of that month-long pattern of consolidation. And that breakout has shown up in a very big way as Gold prices have throttled up to fresh three-month-highs, approaching a key area of resistance on longer-term charts.
Gold Price Daily Chart
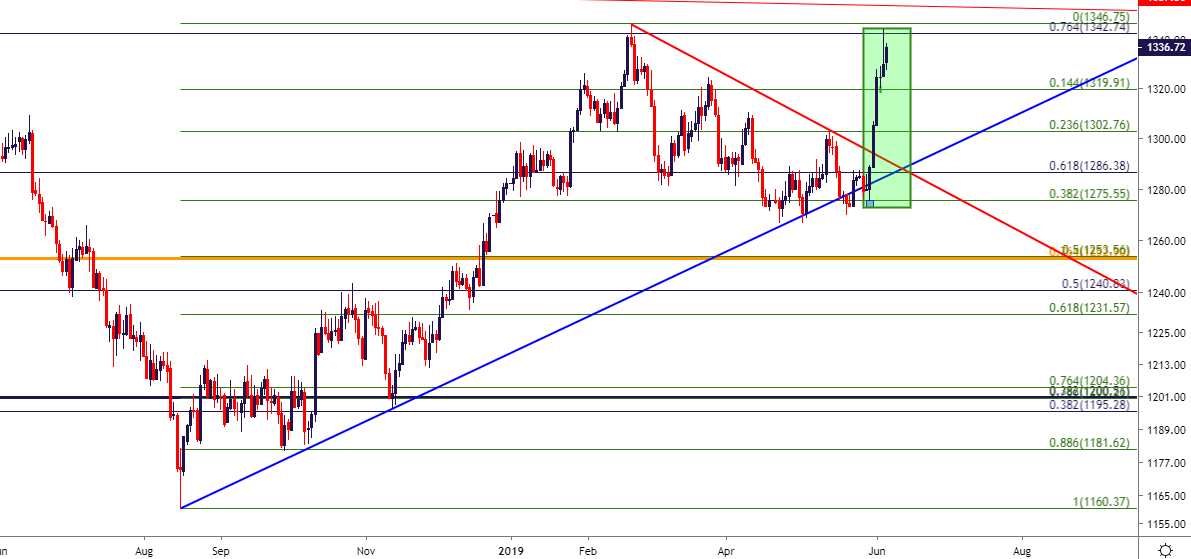
Chart prepared by James Stanley
At this point, the bullish breakout in Gold price action has held resistance at a key level on the chart, and this is the same level that helped to hold the highs back in February when the topside theme was in full bloom. This level is at 1342.74, and this is the 76.4% retracement of the August 2013 – December 2015 major move. This same area has been in-play in the past, along with the 78.6% marker of that same major move, helping to hold bullish runs in 2017 and 2018; with prices showing a series of upper-wicks as sellers responded to this resistance in Q1/Q2 of last year.
Gold Price Weekly Chart

Chart prepared by James Stanley
Above this current chasm of resistance exists a number of prior swing-highs, each of which carries the potential to impede forward progress of this current bullish theme. The five-year-high is at 1375.15 while the two-and-a-half year high exists at 1366.06. And while this recent bullish run has been pronounced and strong, meshing very well with related events in the US Dollar and expectations around FOMC, this could prove a difficult area for Gold bulls should the advance continue without some element of pullback.
What could create that swell? Capitulation at the Federal Reserve would likely help, and with an FOMC meeting approaching in two weeks, that backdrop may soon present itself. But for now, this move in Gold is quite extended, and that could present issues from a risk management perspective for those looking to get long given that prices are so far away from any nearby supports. Tomorrow brings a batch of risk events that may help the current trend to cool, opening the door for higher-low support potential.
A couple of recent areas of interest could be re-integrated into the approach to look for such a theme. Earlier this week, short-term breakout potential was showing in Gold around the 14.4% retracement of the August-February run, opening the door for a test of the prior March high around 1325. A bit-lower, a small portion of unfilled gap remains from this week’s open around the 1306 level, and below that is the 1302.76 Fibonacci level that was looked at last week, opening the door for topside breakouts towards the 1319.91 level. If Gold prices push back-below that price, the bullish theme should be re-evaluated as something in the backdrop has likely shifted.
Gold Price Eight-Hour Chart
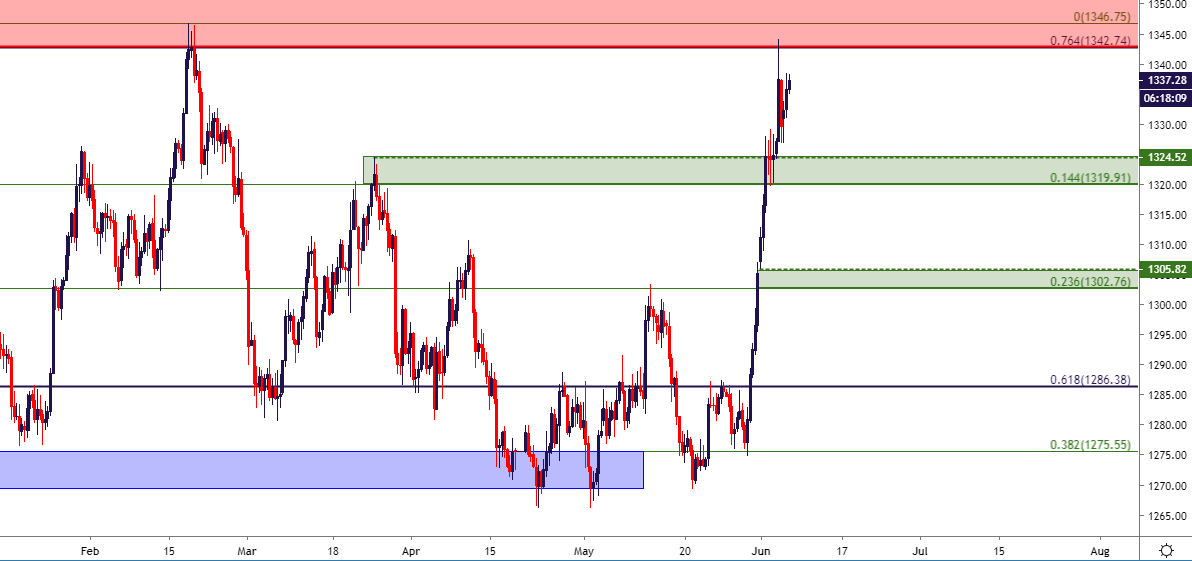
Chart prepared by James Stanley
To read more:
Are you looking for longer-term analysis on the U.S. Dollar? Our DailyFX Forecasts have a section for each major currency, and we also offer a plethora of resources on Gold or USD-pairs such as EUR/USD, GBP/USD, USD/JPY, AUD/USD. Traders can also stay up with near-term positioning via our IG Client Sentiment Indicator.
Forex Trading Resources
DailyFX offers an abundance of tools, indicators and resources to help traders. For those looking for trading ideas, our IG Client Sentiment shows the positioning of retail traders with actual live trades and positions. Our trading guides bring our DailyFX Quarterly Forecasts and our Top Trading Opportunities; and our real-time news feed has intra-day interactions from the DailyFX team. And if you’re looking for real-time analysis, our DailyFX Webinars offer numerous sessions each week in which you can see how and why we’re looking at what we’re looking at.
If you’re looking for educational information, our New to FX guide is there to help new(er) traders while our Traits of Successful Traders research is built to help sharpen the skill set by focusing on risk and trade management.
--- Written by James Stanley, Strategist for DailyFX.com
Contact and follow James on Twitter: @JStanleyFX


