


Talking Points:
- The February Canada GDP report is due on Tuesday, April 30 at 12:30 GMT.
- The Citi Economic Surprise Index for Canada gained from 43.7 to 59.6 during February, a sign that data was coming in better than analysts’ estimates.
- Retail traders are net-short USDCAD but recent changes give us a mixed USDCAD trading bias.
Join me on Mondays at 7:30 EDT/11:30 GMT for the FX Week Ahead webinar, where we discuss top event risk over the coming days and strategies for trading FX markets around the events listed below.
04/30 TUESDAY | 12:30 GMT | CAD Gross Domestic Product (FEB)
The February Canada GDP report doesn’t appear like to will help traders or BOC policymakers find any clarity over the near-term economic environment. It appears that February represented the low point in growth conditions across the world: Eurozone PMIs declined in February; US GDP estimates were lowest in late-February and early-March.
Domestically, conditions appear to have been a bit better for Canada. Looking at data trends during February, the Citi Economic Surprise Index for Canada gained from 43.7 to 59.6. On balance, continued improvement among domestic factors may offset rising issues among external factors. Accordingly, Bloomberg News is looking for the yearly growth rate in February to stay on hold at 1.6%, the same rate in January (following the 0.4% annualized growth rate in Q4’18).
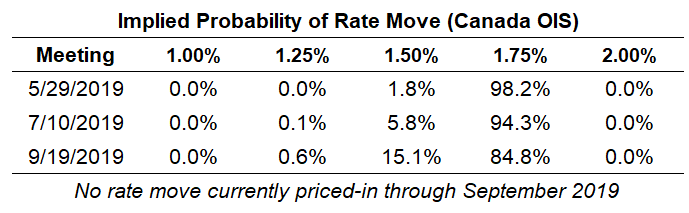
Despite the fact that Canadian economic data has remained strong over the past several weeks (the Surprise Index is now at 54.8), concerns over global growth have provoked the Bank of Canada into a more neutral policy stance; it was just last Wednesday when the BOC eliminated its bias for any rate hikes this year. Nevertheless, odds of a 25-bps rate cut by September remain low, currently at 15.1%.
Pairs to Watch: CADJPY, EURCAD, USDCAD
USDCAD Price Chart: Daily Timeframe (November 2017 to March 2019) (Chart 1)
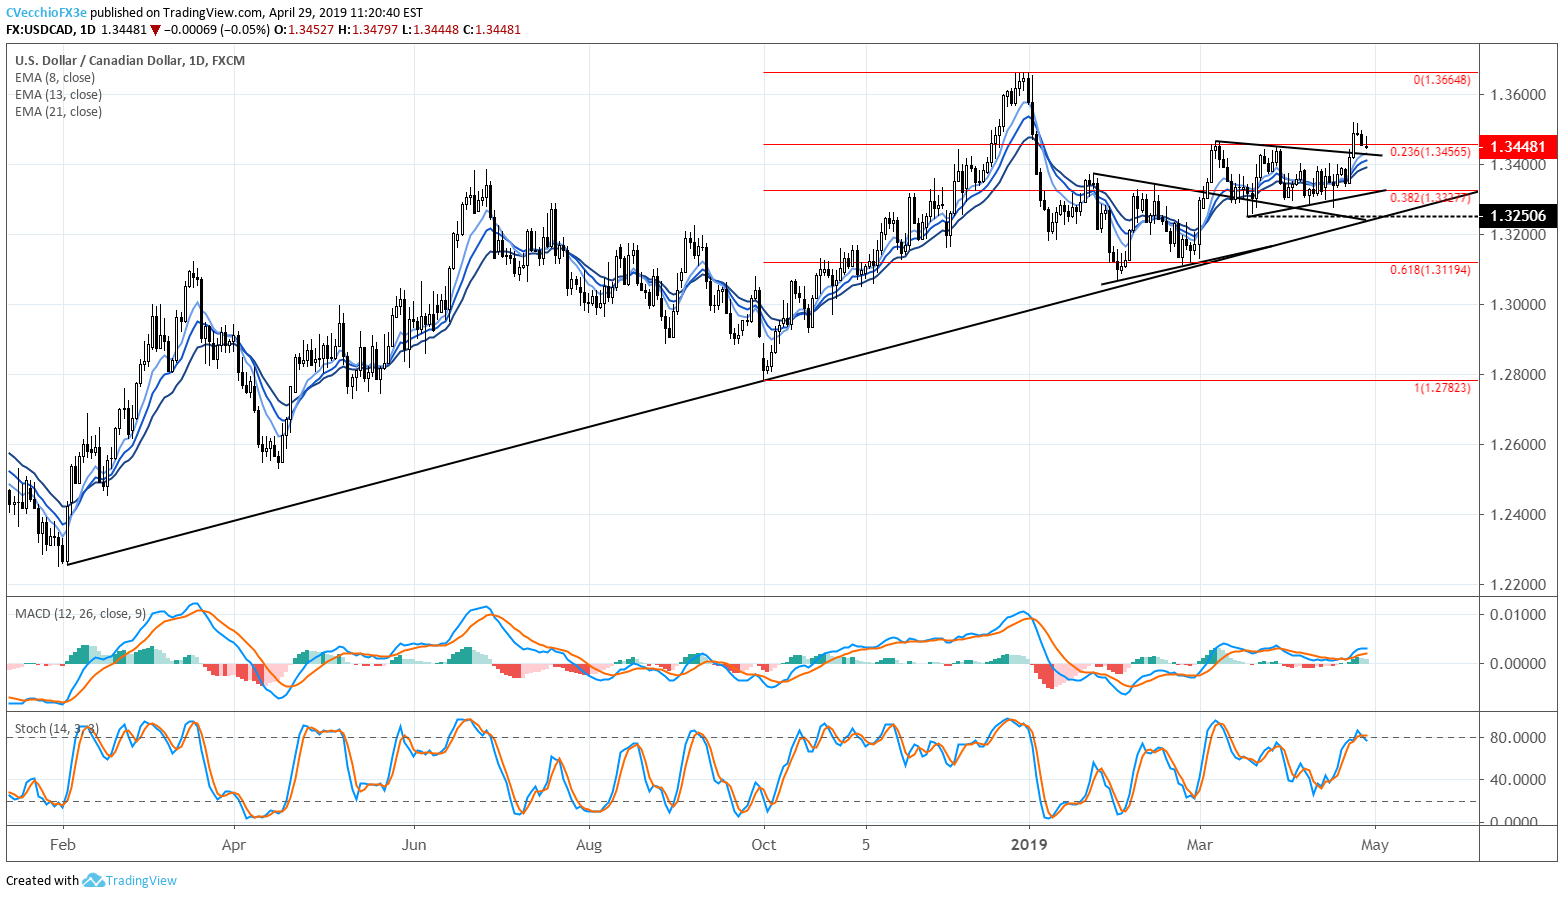
USDCAD prices have seen little follow-through following the bullish breakout from the symmetrical triangle last week. The April BOC meeting catalyzed the move higher, and even as the DXY Index has moved to fresh yearly highs, USDCAD has yet to push to a fresh high post-BOC.
That said, it’s far too soon to say that the bullish breakout attempt is a failure; traders may simply be digesting the move before loading back up for another swing higher. The daily 8-EMA coincides with the symmetrical triangle’s original resistance now turned support around 1.3430; if the bullish breakout attempt is valid, then this level should hold. Failure below 1.3430 would increase the odds of a reversal within the triangle itself back towards original support around 1.3330 (near the 38.2% retracement of the Q4’18 low to Q4’19 high range at 1.3327).
IG Client Sentiment Index: USDCAD (April 29, 2019) (Chart 2)
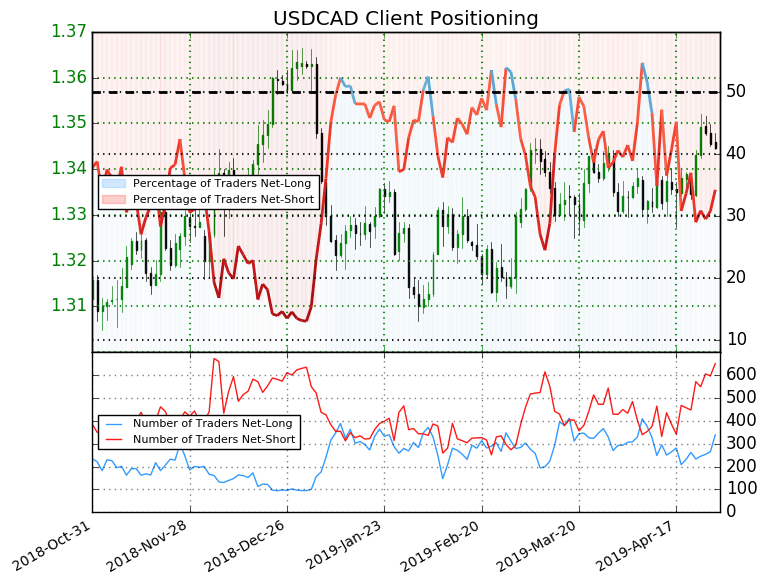
USDCAD: Retail trader data shows 34.2% of traders are net-long with the ratio of traders short to long at 1.92 to 1. In fact, traders have remained net-short since Apr 17 when USDCAD traded near 1.33574; price has moved 0.7% higher since then. The number of traders net-long is 28.0% higher than yesterday and 27.1% higher from last week, while the number of traders net-short is 4.0% higher than yesterday and 37.1% higher from last week.
We typically take a contrarian view to crowd sentiment, and the fact traders are net-short suggests USDCAD prices may continue to rise. Positioning is less net-short than yesterday but more net-short from last week. The combination of current sentiment and recent changes gives us a further mixed USDCAD trading bias.
FX TRADING RESOURCES
Whether you are a new or experienced trader, DailyFX has multiple resources available to help you: an indicator for monitoring trader sentiment; quarterly trading forecasts; analytical and educational webinars held daily; trading guides to help you improve trading performance, and even one for those who are new to FX trading.
--- Written by Christopher Vecchio, CFA, Senior Currency Strategist
To contact Christopher, email him at cvecchio@dailyfx.com
Follow him in the DailyFX Real Time News feed and Twitter at @CVecchioFX


