


Talking Points
-Dow Jones Industrial Average (DJIA) continues to consolidate near all-time highs
-Fed rate hike expectations remain unchanged, therefore nothing is pushing the market at the moment
-A technical correction to 18,167 area cannot be ruled out and would be normal within the context of this up trend
Dow Jones Industrial Average continues its consolidation near recent all-time highs. As we stated on Tuesday, this appears to be a technical correction that is anticipated to be shallow.
The Fed was unable to wake the market participants, mostly because they didn’t present anything new. Fed futures still suggest about a 48% chance of a rate hike in December 2016 which is little moved from the reading prior to yesterday’s rate announcement.
On Tuesday, we highlighted 2 levels that may offer support if prices continue to drift lower. In US30, a CFD which tracks the DJIA, a move lower to 18,365 (May 19, 2015 high) or 18,167 (April 20 high) cannot be ruled out.
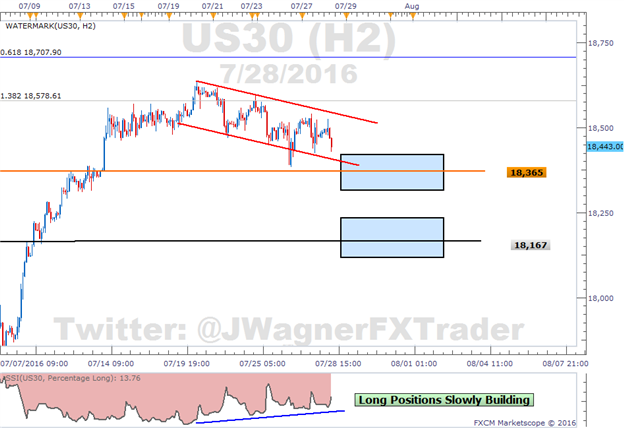
Chart prepared by Jeremy Wagner
Tuesday afternoon, DJIA did fall to 18,387 which is just above the first level. The subsequent bounce higher from Tuesday has been feeble while lacking momentum. That suggests prices may continue to drift lower and actually touch 18,365 or 18,167.
From a sentiment perspective, the number of short traders are 10% below last week’s levels while the number of longs are 23% above last week. This has shifted SSI slightly more positive and now sits at -6.4. SSI is a contrarian type of indicator such that when it shifts positive, look for prices to dip. (Learn how to trade with SSI here.)
Though the short term outlook appears boring, the medium term outlook remains bullish towards 19,700. If price momentum begins to dig down into 17,800, then we’ll reconsidered the higher probability patterns. In the short term, we’ll focus on lower levels of 18,365 or 18,167 to buy the dip.
Day traders for DJIA can follow the Grid Sight Index (GSI) for intraday momentum swings. GSI is a big data indicator which analyzes millions of price points and thousands of trend components in real time to determine how many historical patterns match up to the current price action. The results show how previous patterns have behaved, though past performance is not indicative of future results.
Check out US30 on ‘m3’ or ‘m5’ via GSI here.
Interested in a longer term outlook for equities? Download our quarterly forecast here.
Good luck!
Suggested Reading:
Dow Jones Industrial Average Punches Back After Brexit Collapse
Do your losing trades overshadow your winning trades? Learn about the psychology behind why that might be happening in our Traits of Successful Traders research.
---Written by Jeremy Wagner, Head Trading Instructor, DailyFX EDU
Follow me on Twitter at @JWagnerFXTrader .
See Jeremy’s recent articles at his Bio Page.
To receive additional articles from Jeremy via email, join Jeremy’s distribution list.


