


Talking Points
-Volume contracted on the breakout and subsequent pull back (mixed signal)
-Sentiment shifts towards more buyers and less sellers (bearish shift in signal)
-1.0980 is an immediate key level to the bullish Elliott Wave pattern
EUR/USD is about 250 pips from its February 11 high where technical resistance was found. What does volume, sentiment, and technical analysis suggested for the pair?
Volume
We commented in our previous report how EUR/USD was breaking above technical resistance, yet volume was not supporting that breakout. Prices subsequently found resistance in the name of a former trend line that we’ve been watching. If volume for the move higher to 1.1376 was weak, the volume for the move down to current levels is even weaker.
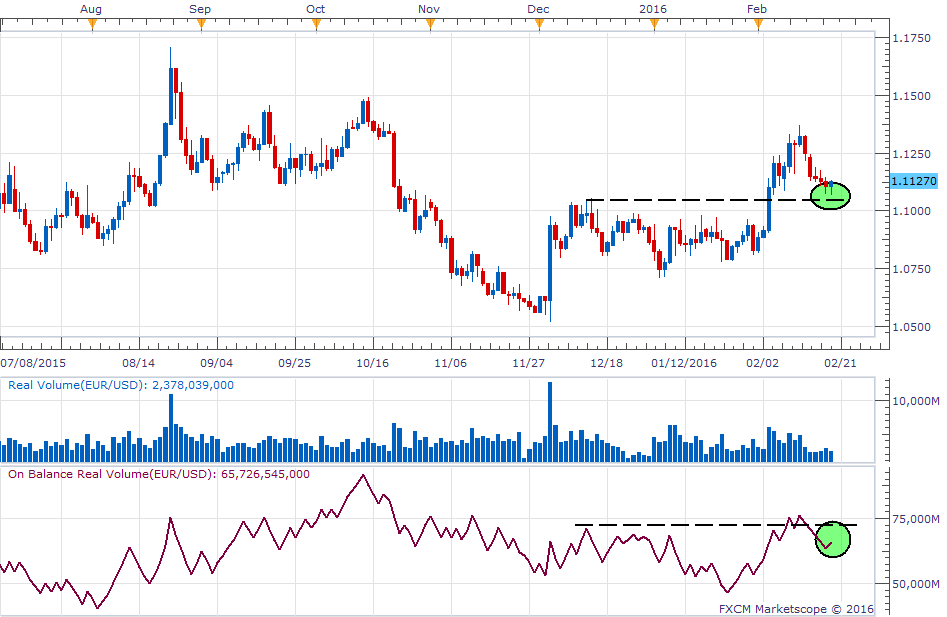
[Image 1 - Created using FXCM’s Marketscope Charts]
Notice how the blue volume bars on the chart above are decreasing as the pair moves lower. Additionally, the on balance volume indicator continues to remain below the December 15 high even though price remains supported above this level. Large volume days in either direction may begin to hold clues about the next major move.
Suggested Reading: Finding On Balance Volume Trading Signals
Sentiment (SSI)
Sentiment as measured through FXCM’s Speculative Sentiment Index (SSI) is showing a growing trend towards longs. As you can see on the picture below, the shaded area represents the SSI reading and is moving higher. This is a result of the number of shorts reducing (red line in sub-chart) while the longs are slowly gaining (green line in sub-chart).

[Image 2]
The reading hasn’t become a full blown bull signal yet, as the SSI is merely sitting at levels we saw back in December when EUR/USD was trading just below 1.10. However, should SSI grow further from its current -1.46 reading, then we might need to shift towards the alternative bearish scenario noted below.
(Follow FXCM’s trader positioning through the live SSI feed.)
Elliott Wave Count #1 – Flat Correction Higher for 1.17 Retest (Bullish)
This is the preferred picture at the moment. Notice how red wave ‘A’ is made up of 3 waves. Red wave ‘B’ is made up of 3 waves. That means the ‘C’ leg needs to contain 5 waves higher either as an impulse or diagonal. We know from Elliott Wave Theory that ‘C’ legs are always made up of 5 waves, with the exception of ‘C’ legs in triangles. Therefore, we are in the process of counting 5 waves higher that retests 1.1720.

[Image 3]
We’re not sure at this point if this current move lower from last week’s high is a smaller degree wave ‘iv’. If it is, prices should hold up above the wave ‘i’ high of 1.0980. Additionally, we have a 200 day simple moving average floating around near 1.1053 (not shown). As a result, this bullish wave count is still on track as prices sit near a good risk to reward ratio for bullish trades. That is to say a trader could look to initiate long positions with a stop loss just below 1.0980 while targeting new highs near 1.1720.
This would yield about a 1:4 risk to reward ratio. We discuss the importance of positive risk to reward ratio trades and how it benefited traders with live accounts in our Traits of Successful Traders research (page 7-9). Note that we can’t guarantee you’ll be profitable by implementing these techniques, but perhaps you can find an area of your trading behavior to tweak.
Elliott Wave Count #2 – Ending Diagonal Pattern Lower (Bearish)
If prices do break below the wave ‘i’ high, it doesn’t necessarily negate other bullish wave counts. However, it will elevate the potential for this preferred bearish wave count which is an ending diagonal. It is still early in this pattern as it suggests last week’s 1.1376 high was the end of wave 2 of 5. That means prices would sell off in 3 waves to below 1.0517 to finish wave 3 of 5. Therefore, bears can get more excited on a break below 1.0980.
If SSI grows more positive and possibly even flips to net positive, then this wave count should be given more weight.
Conclusion
With volume hanging on balance and not tipping its hand either way, SSI is still showing bullish signals, but those signals are weakening so we are cautiously bullish the EURUSD for a 1.1720 retest. Watch your volume and SSI live to get immediate reaction from market participants about the potential change in direction.
Suggested Reading:
EUR/USD Tests Key Resistance 1.1087
Gold Prices Attempting 5 Weeks of Gains
USD/NOK Consolidates After January Sell Off
Happy trading!
---Written by Jeremy Wagner, Head Trading Instructor, DailyFX EDU
Follow me on Twitter at @JWagnerFXTrader .
See Jeremy’s recent articles at his Bio Page.
To receive additional articles from Jeremy via email, join Jeremy’s distribution list.


